MARKET
PULSE
Saudi Arabia Real Estate
the quarter the access rules changed

Q1 2026 at a Glance
Lending found a lower gear, prices corrected further, land activity froze - and the door to foreign capital swung open.
The Quarter in One Paragraph
The first quarter of 2026 hardened the reset: banks wrote SAR 15.75 billion of new residential mortgages, (43%) below a strong Q1 2025, with March at SAR 4.19 billion - the weakest single month since April 2023. The official price index recorded a fourth consecutive residential decline at (3.6%) while commercial values rose +3.4%, and the land market bore the brunt of policy: recorded land deals fell (55%) as the escalated White Land fee entered its first Riyadh billing cycle. Yet the quarter's defining story was access, not activity - the foreign-ownership law entered into force on 21 January, and from 1 February the abolition of the QFI regime opened the Saudi main market to every class of foreign investor. The equity market noticed: TASI gained +7.2% and 12 of the 19 listed REITs closed the quarter higher.
Lending: The Three-Month Path
January opened at SAR 6.19 billion and March closed at SAR 4.19 billion - each month roughly half its year-ago level.
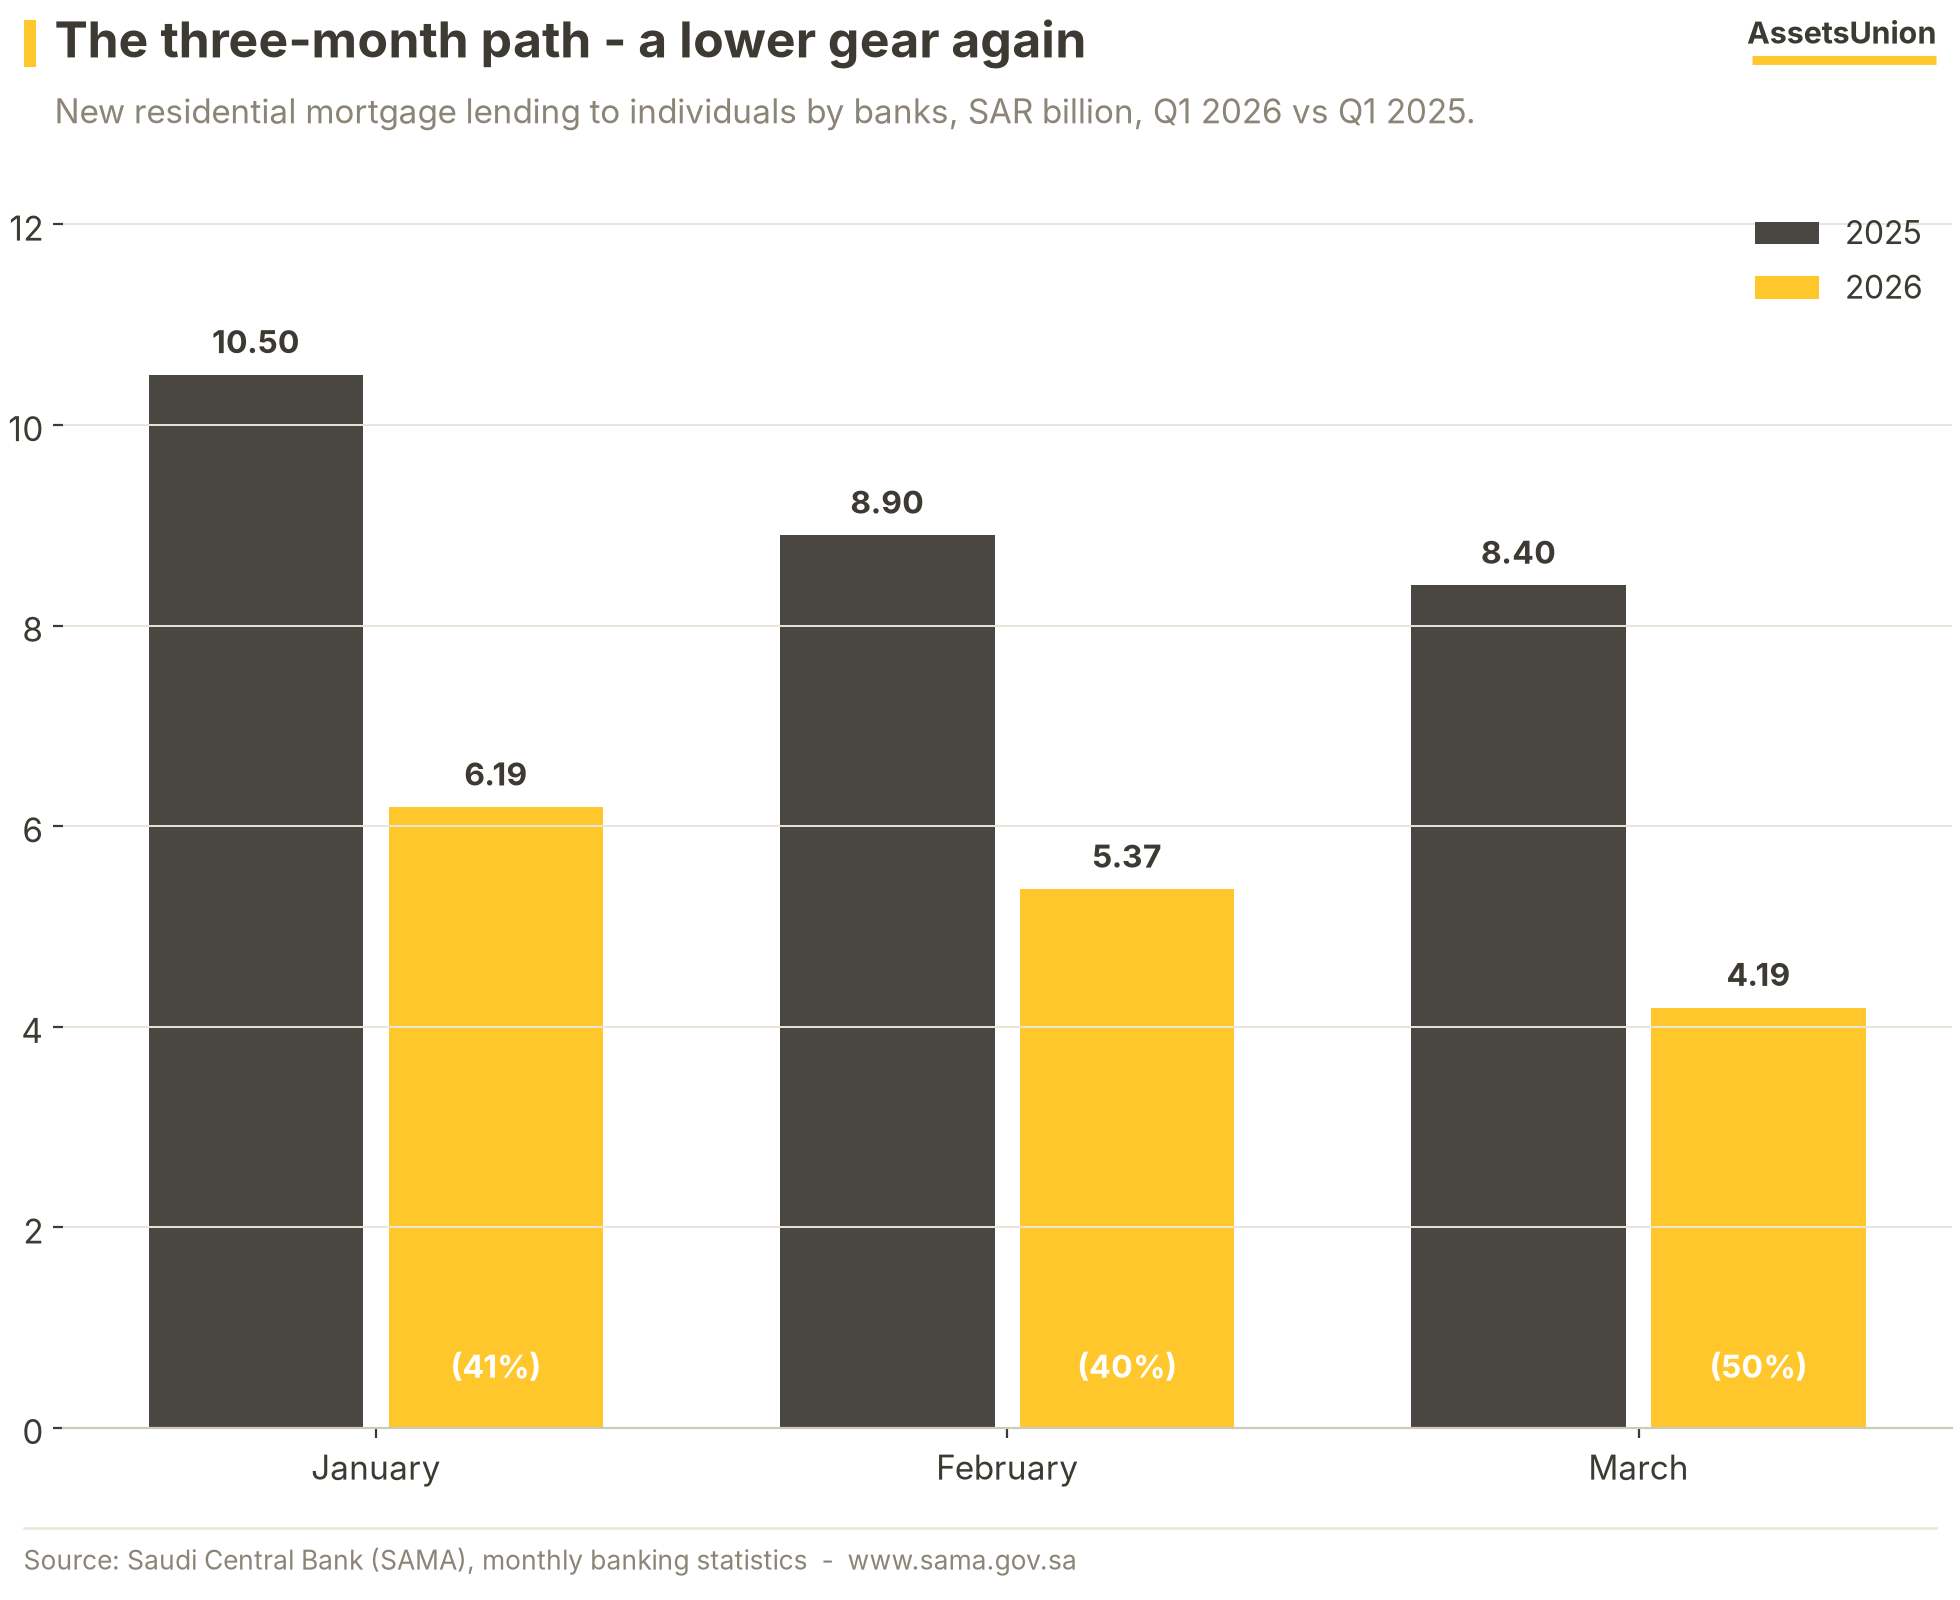
The quarter never found traction: January wrote SAR 6.19 billion ((41%) year on year), February SAR 5.37 billion ((40%)) and March just SAR 4.19 billion ((50%)) - the lowest monthly print since April 2023. The base effect matters: Q1 2025 was the strongest quarter of that year, so year-on-year comparisons are at their harshest here and mechanically ease from May onward. The level, not the growth rate, is the cleaner read - and the level says the market has stepped down to a SAR 4-6 billion monthly run-rate.
Nine Quarters of Normalisation
From SAR 30.1 billion in Q4 2024 to SAR 15.75 billion - the quarterly series has halved in five quarters.
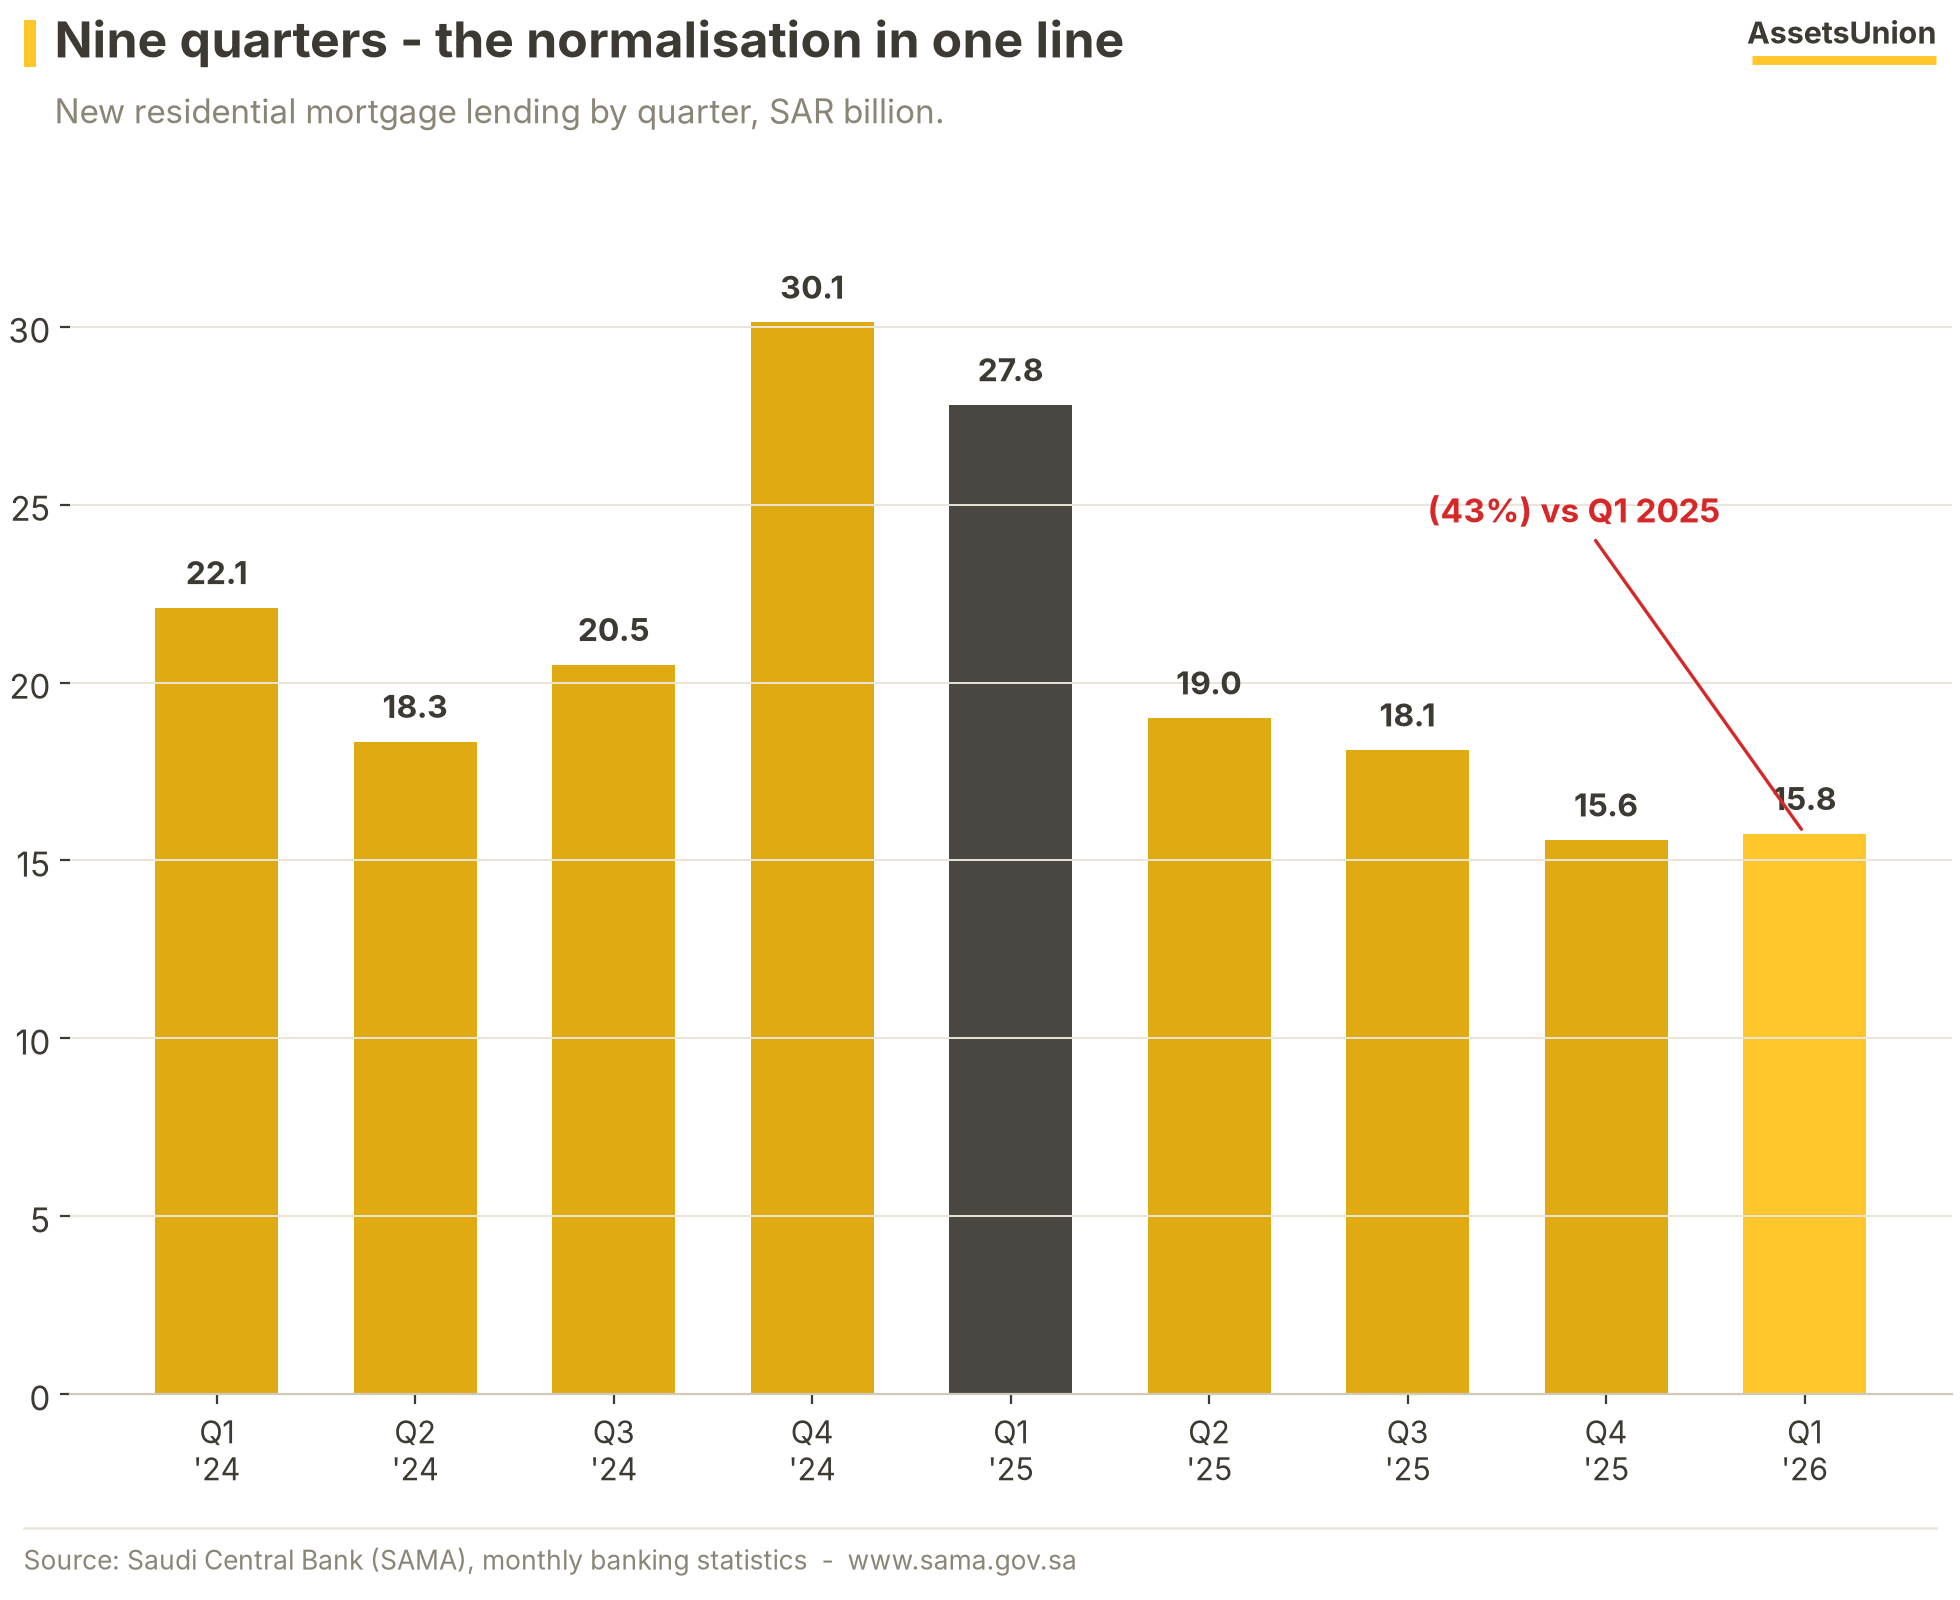
On the quarterly ledger the descent is orderly: after the Q4 2024 re-acceleration to SAR 30.1 billion, every quarter of 2025 stepped lower, and Q1 2026 lands at SAR 15.75 billion - essentially flat on Q4 2025's SAR 15.6 billion. That sequence is the most constructive detail in the data: the quarter-on-quarter decline has stopped. What is still missing is an upturn - and with the repo rate parked at 4.25%, the trigger will have to come from affordability, price expectations, or the new foreign-demand channel rather than from cheaper money.
What the Money Bought
Villas held nearly two thirds of lending value; the average mortgage got smaller for a second straight quarter.
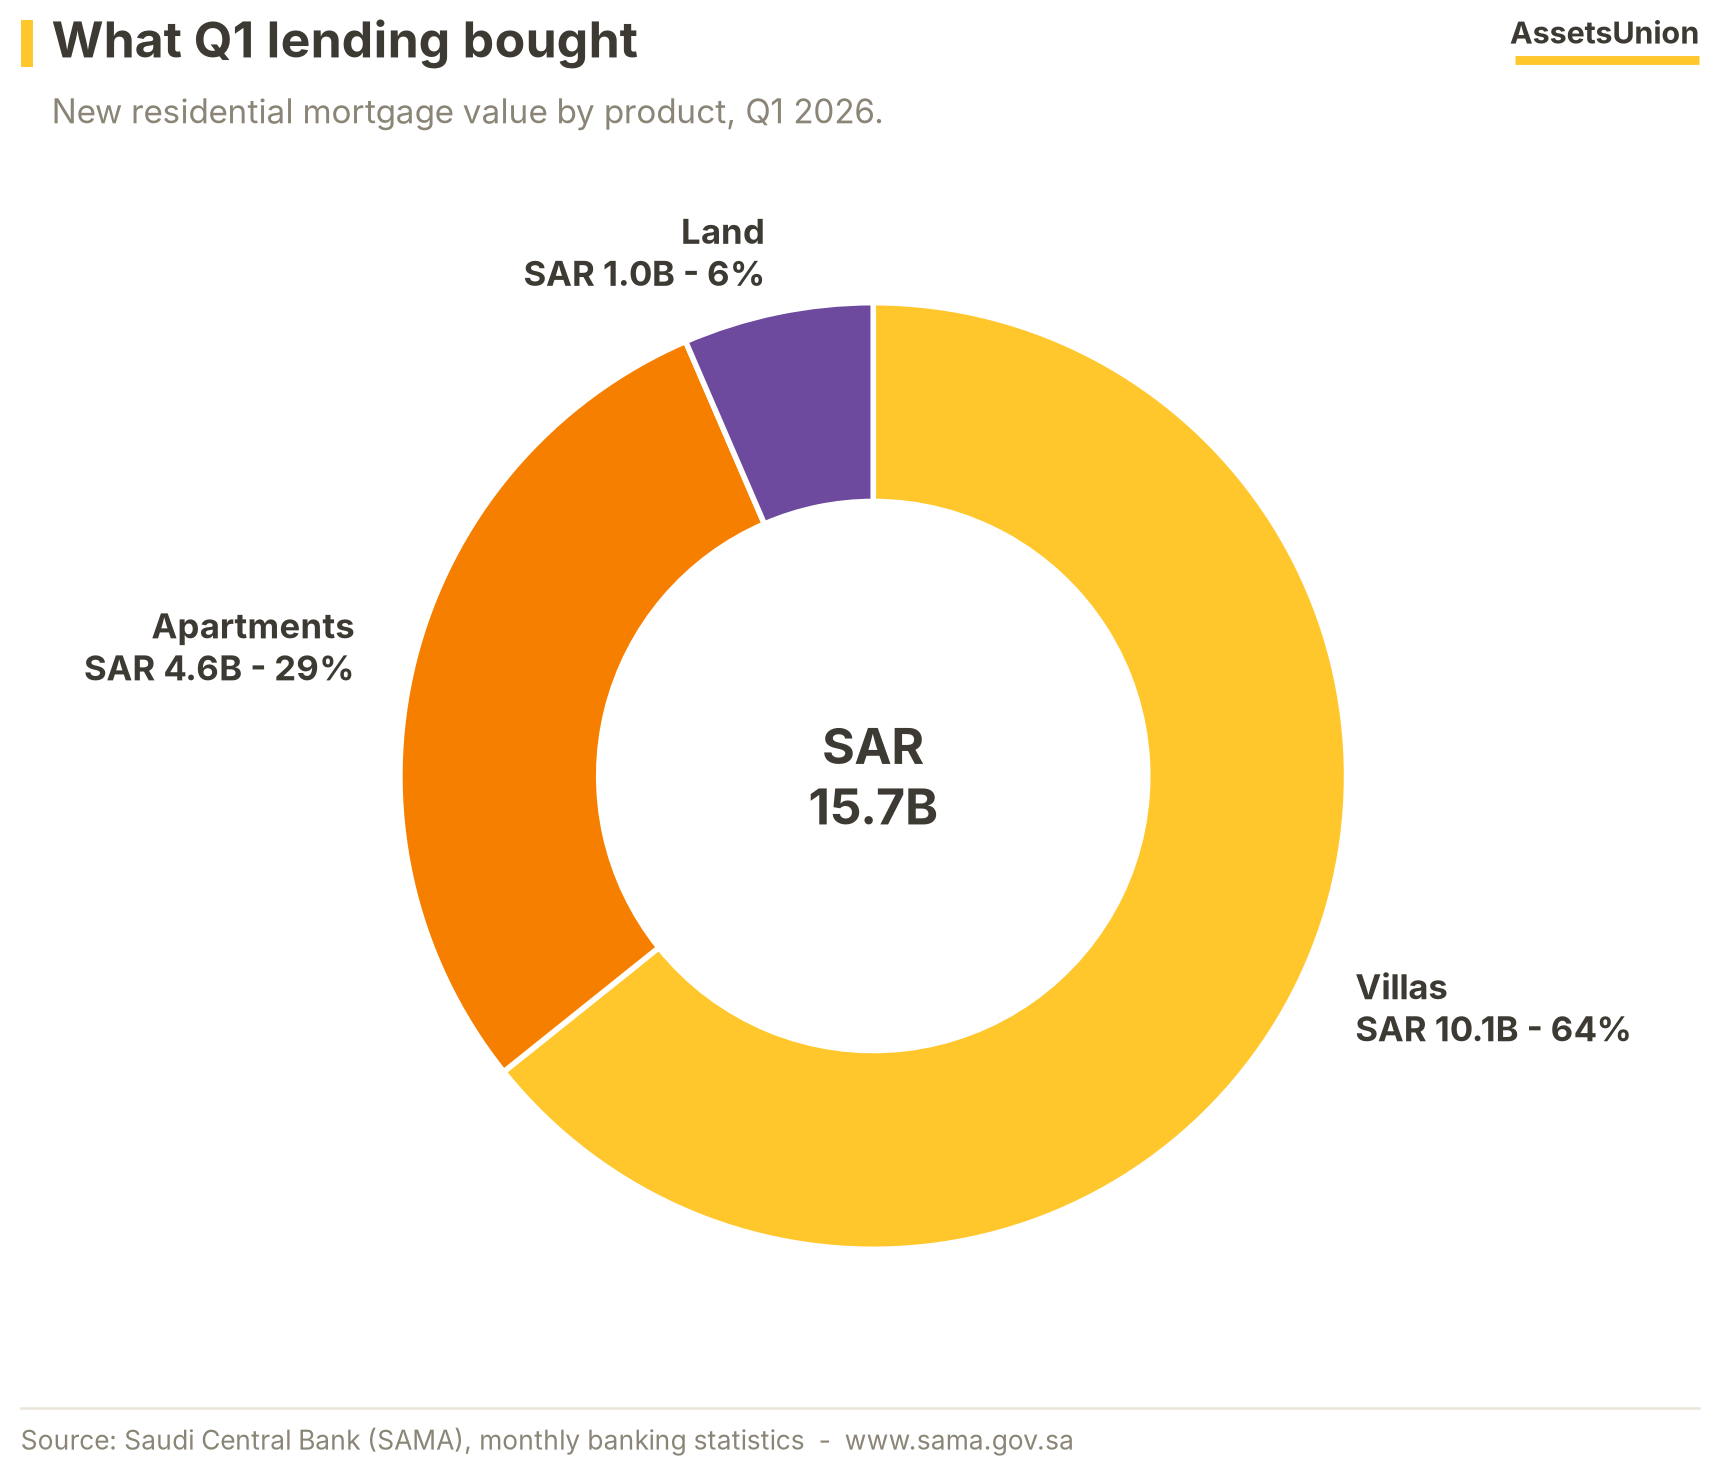
Villas took SAR 10.1 billion (64%) of the quarter's lending value, apartments SAR 4.6 billion (29%) and land plots SAR 1.0 billion (6%) - a mix unchanged from full-year 2025 even as volumes halved. The ticket size is quietly repricing: February's average mortgage of SAR 643,000 was (15%) below a year earlier and March's SAR 655,000 (13%) - buyers are borrowing less per home, consistent with softer prices and tighter affordability. Contract counts tell the same story: 8,400 in February and 6,400 in March.
Prices: Five Quarters to Correction
From +5.12% to (3.6%) in five prints - the residential index has now declined for four consecutive quarters.
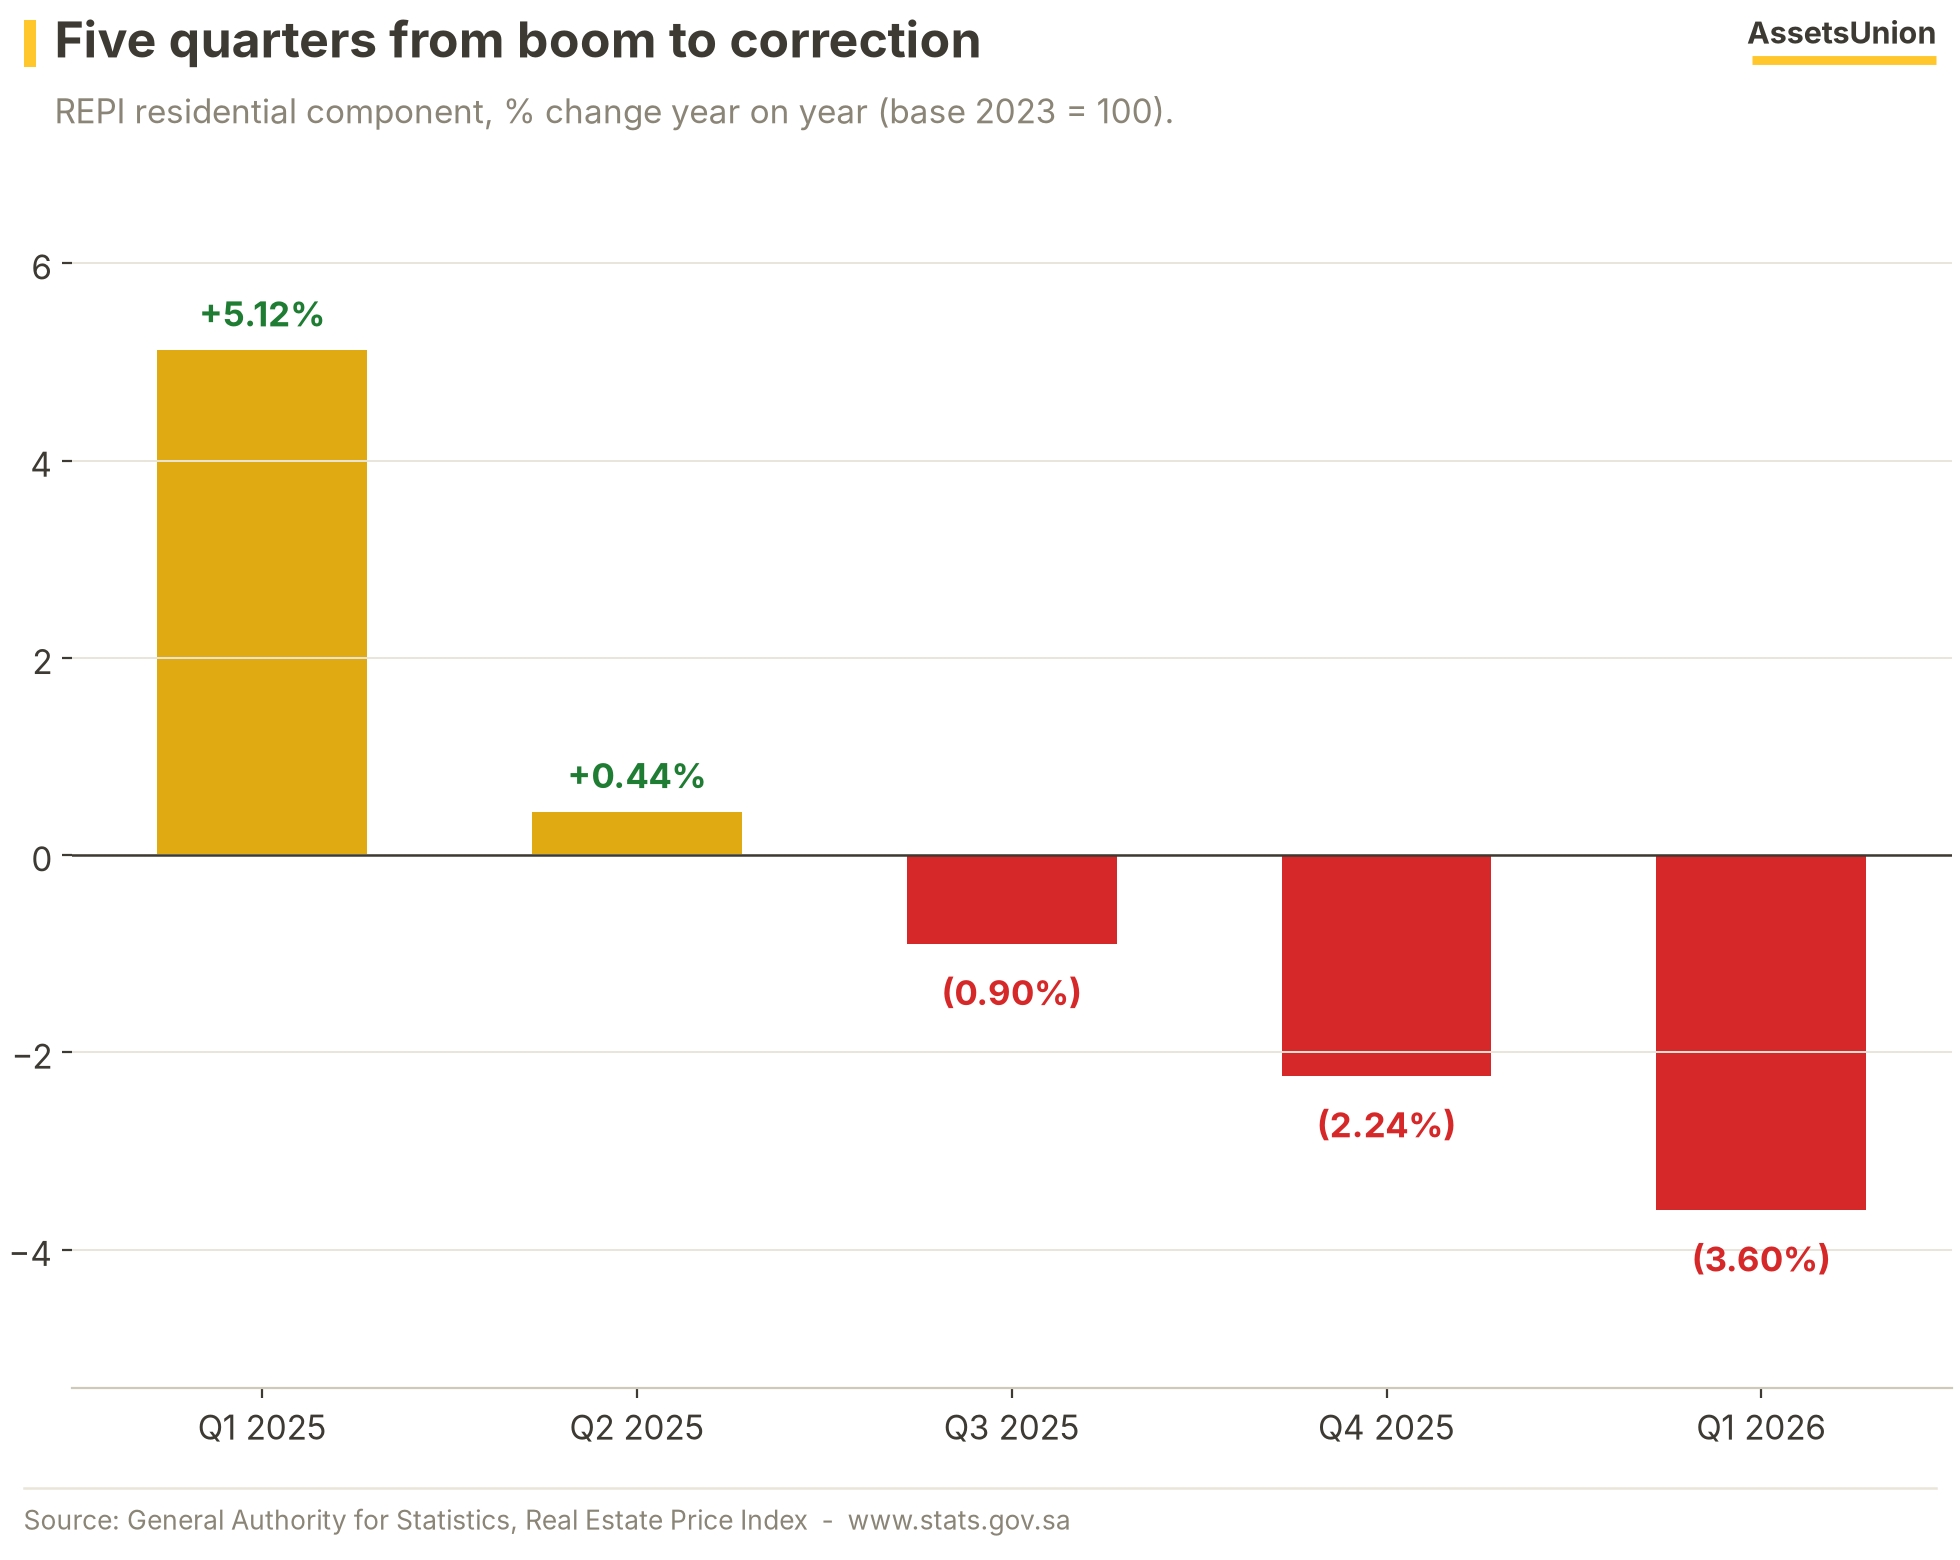
The residential REPI fell (3.6%) year on year in Q1 2026, extending the correction that began in Q3 2025 and deepening from Q4's (2.24%). The path from +5.12% growth to a (3.6%) decline took exactly five quarters - a textbook rollover, arriving in step with the lending reset rather than ahead of it. Note the series convention: GaStat rebased the REPI at Q3 2024 (base 2023 = 100), so this chart splices nothing and reads entirely on the new vintage.
Inside the Q1 Print
One index, three directions - residential down, commercial up, agricultural sprinting.
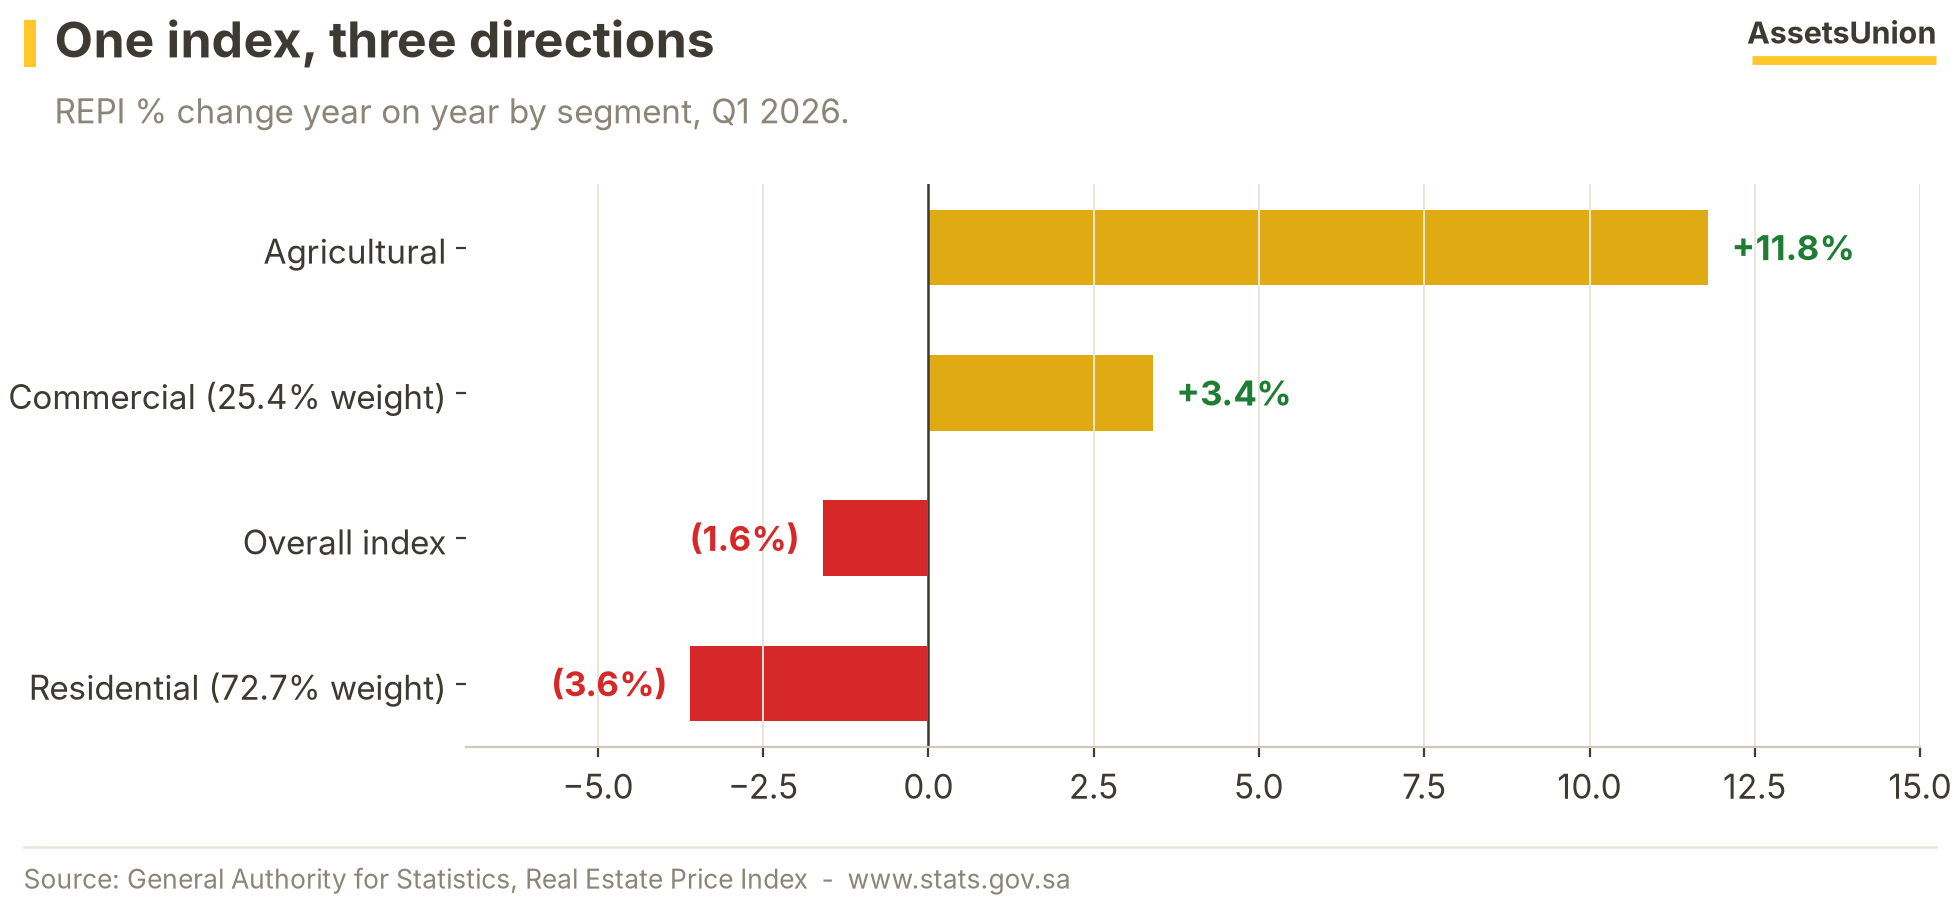
The overall index eased (1.6%) to 103.3 points, but the composite hides a genuine divergence: the residential component (72.7% of the index) fell (3.6%) while commercial (25.4%) rose +3.4% and agricultural land jumped +11.8%. This is not a market falling uniformly - it is a market repricing residential assets specifically, while income-producing commercial property and farmland hold their bid. For valuation work the segment split matters more than the headline.
The Regional Map
Eastern Province up 6.9%, Riyadh down 4.4% - the correction remains uneven by geography.
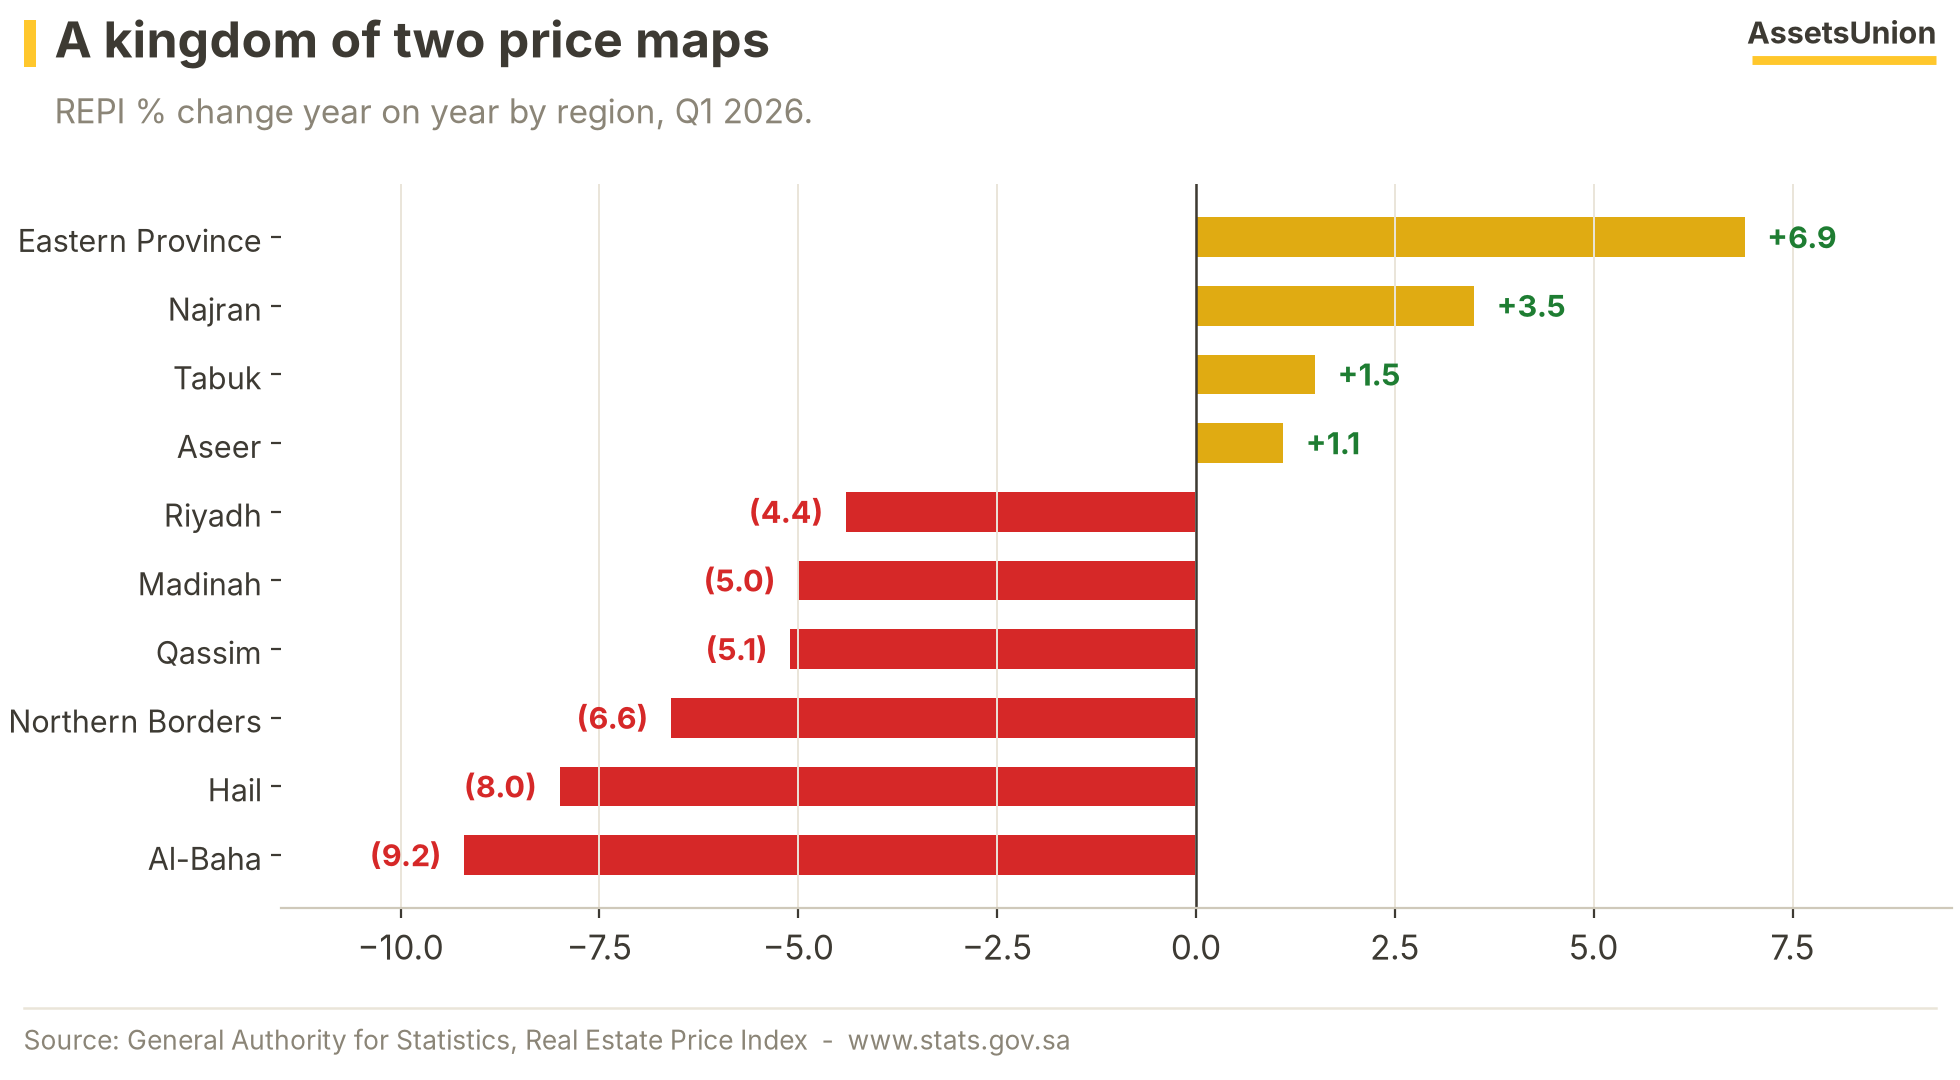
Four regions posted gains - led by the Eastern Province at +6.9% - while the declines concentrate in Riyadh ((4.4%)), Madinah ((5.0%)), Qassim ((5.1%)) and the smaller northern and southern regions, with Al-Baha at (9.2%). Riyadh's decline carries the most weight: it is the deepest supply pipeline and the market where the White Land escalation and the migration of deals to the new Real Estate Registry are both landing first. The regional split is the framework's key watch item into mid-2026.
The Transaction Ledger
The land trade froze first - deals down 55%, value down 65% - exactly as the holding cost of idle land went live.
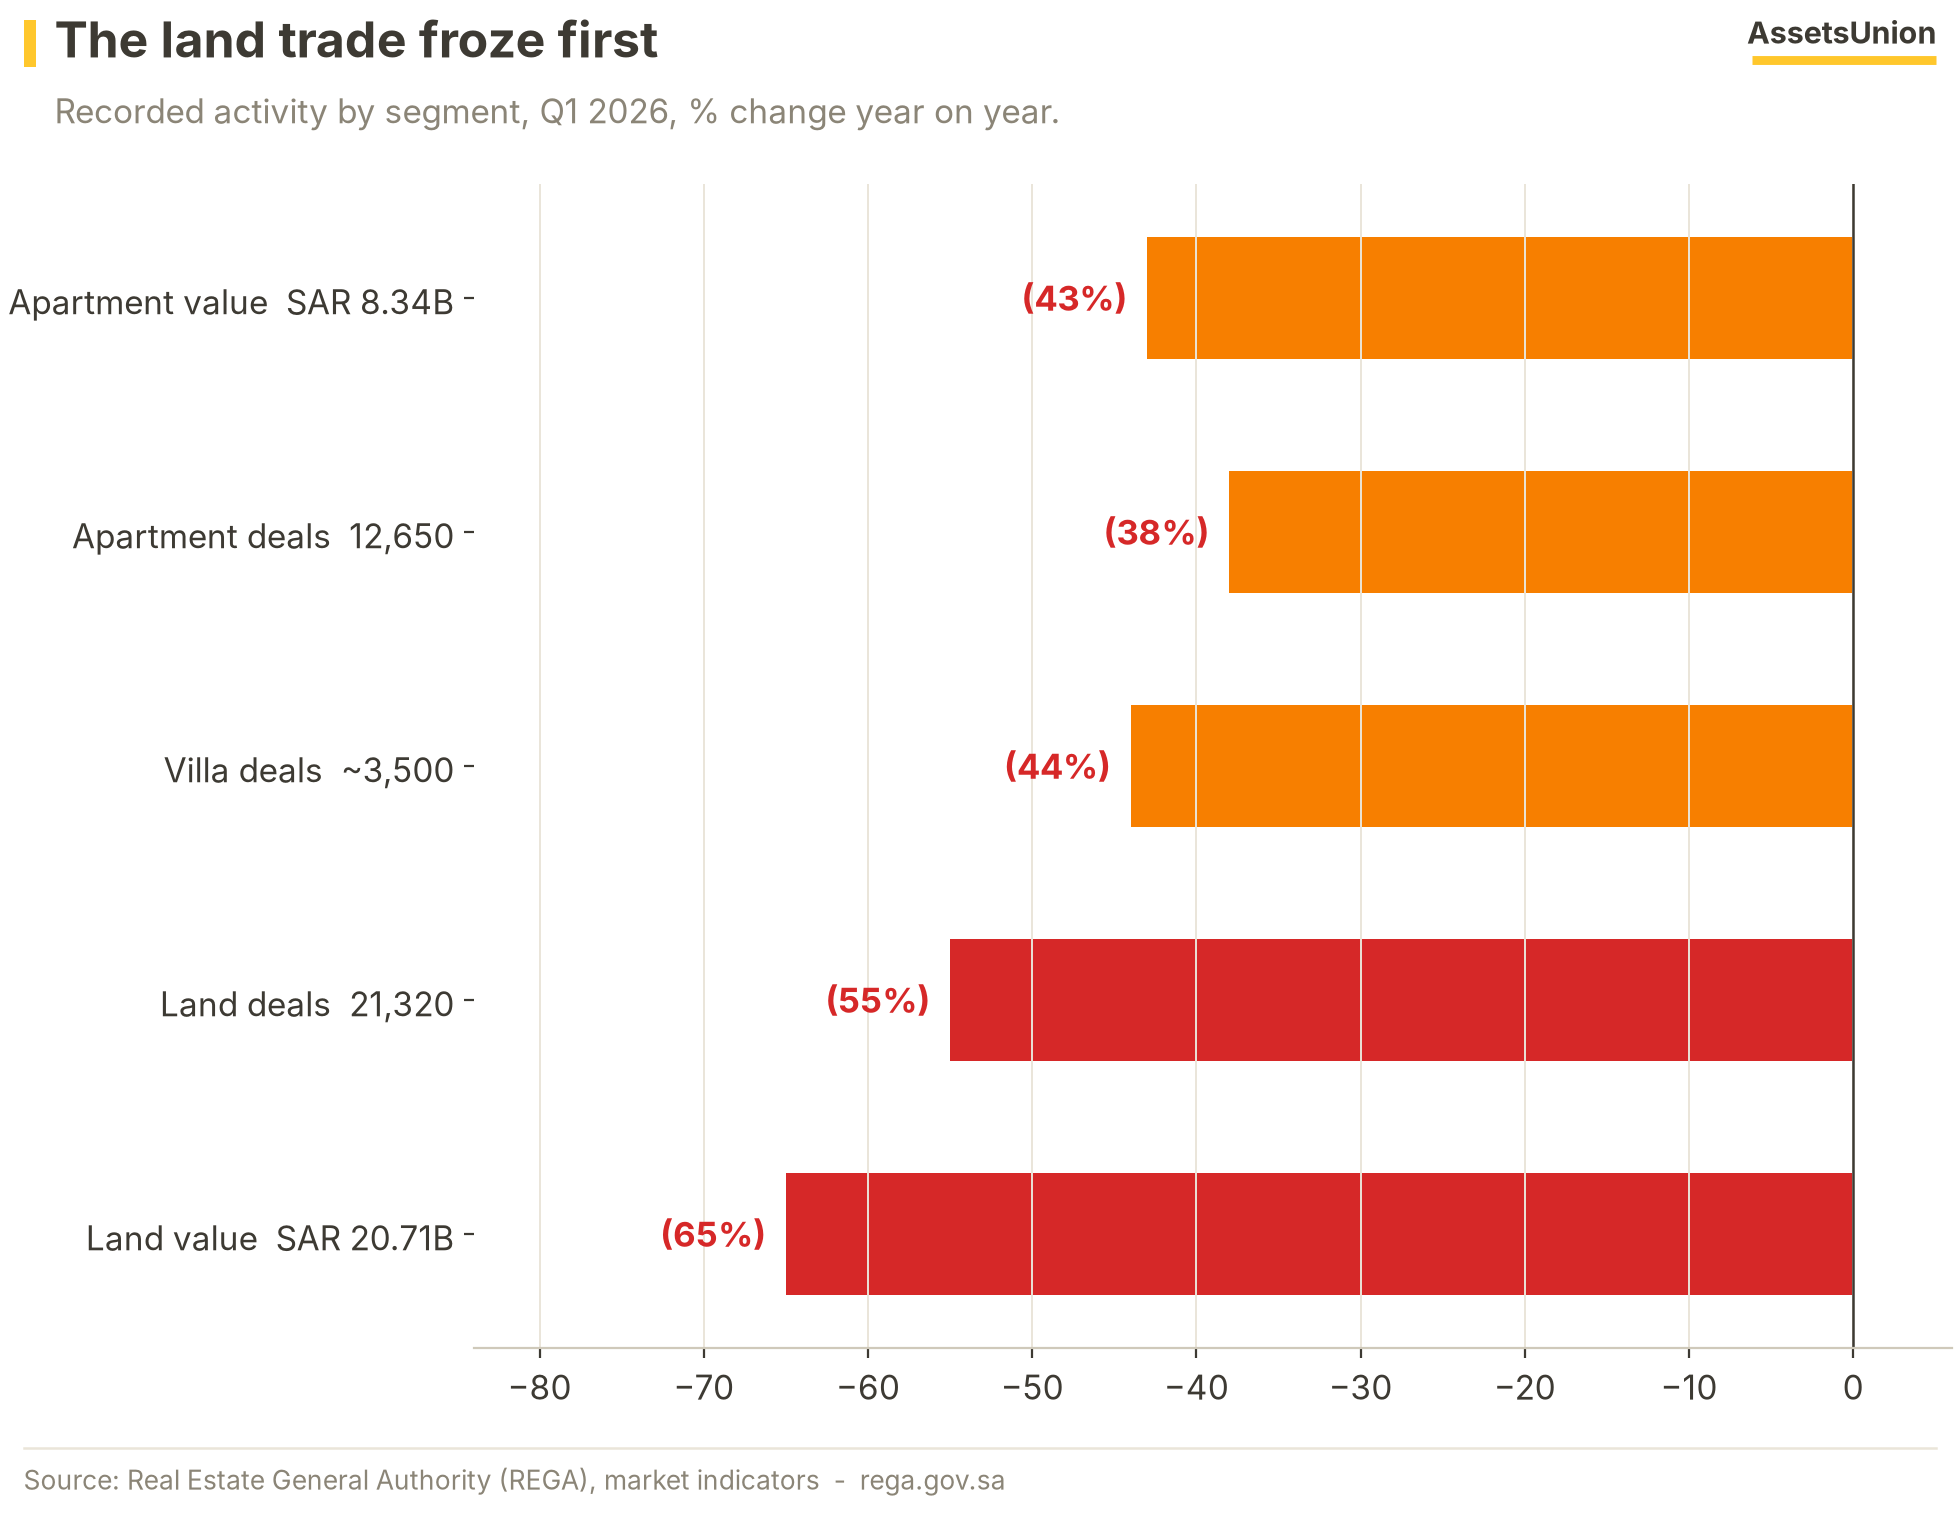
REGA's market indicators put Q1 land deals at 21,320 ((55%) year on year, the lowest on the series) worth SAR 20.71 billion ((65%)); apartment deals fell (38%) and villa deals (44%). Two forces overlap: the White Land fee's first Riyadh billing cycle - over 60,000 invoices from 1 January - has made holding undeveloped land expensive precisely when its exit price is falling, and Riyadh's transaction ledger is migrating to the Real Estate Registry, which depresses the legacy series. Read levels with care this year; read the land-segment collapse as policy working as designed.
Regulation: The Access Quarter
Ninety days that rewired who may own and who may invest - the structural story of Q1 2026.
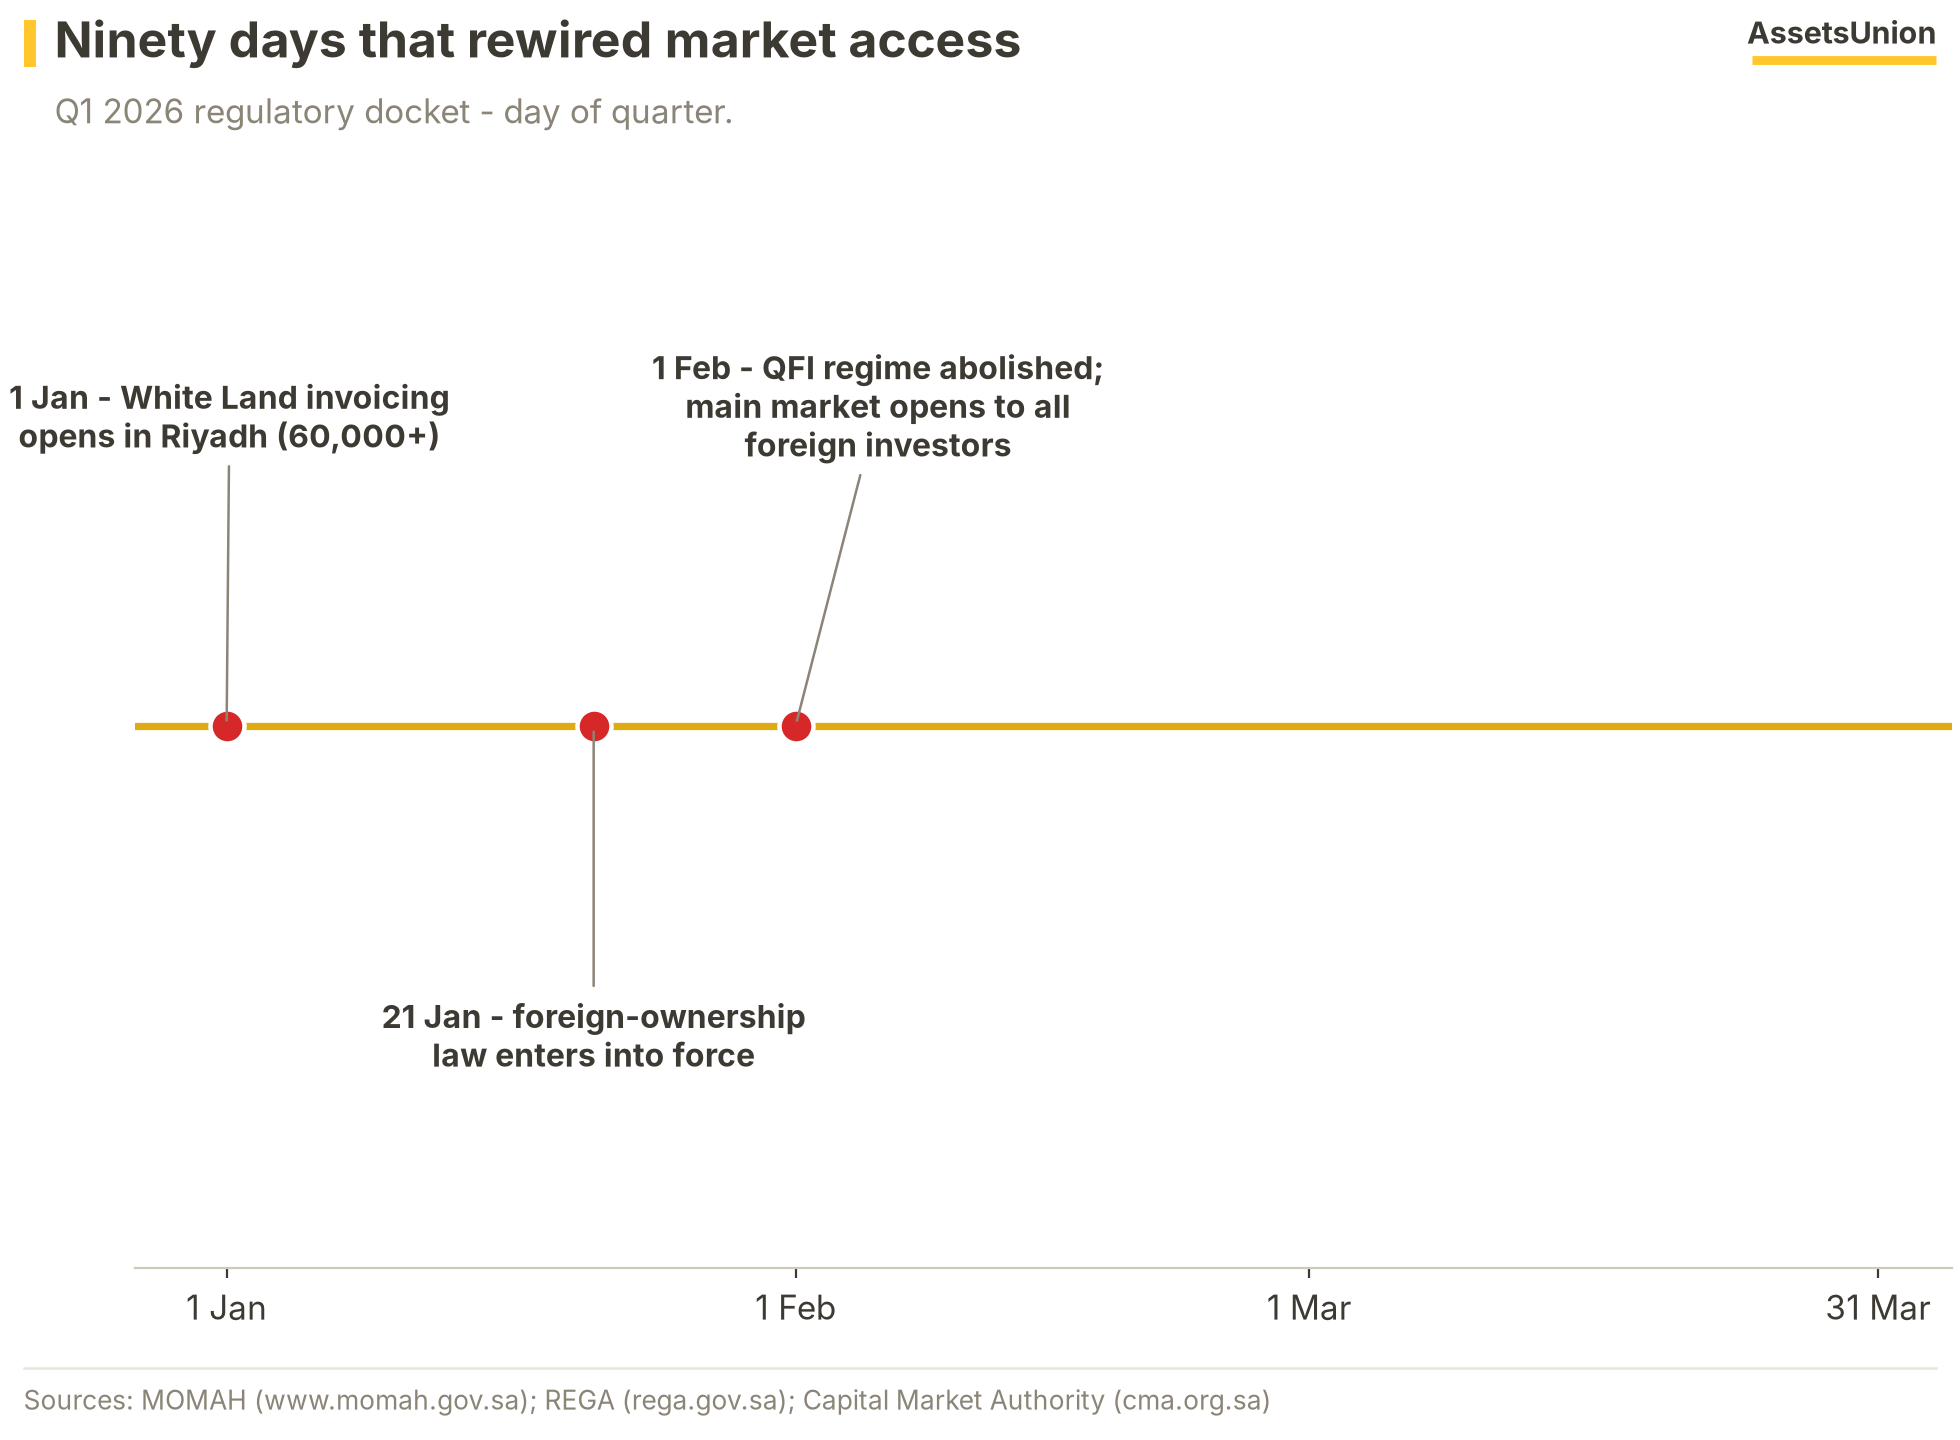
1 January - White Land invoicing opened in Riyadh under the amended law's tiered rates of up to 10% a year. 21 January - the Law of Real Estate Ownership by Non-Saudis entered into force, replacing the old purpose-based regime with a zoning framework; REGA may levy a disposal fee of up to 5% on non-Saudi transactions. 1 February - the Capital Market Authority abolished the QFI regime, opening the main market - including every listed REIT - to all categories of foreign investor. The designated ownership zones followed in June; Q1 was the quarter the legal rails were laid.
The Cost of Money
No decisions, no drama: the repo rate spent the whole quarter at 4.25% while the US Federal Reserve stayed on hold.
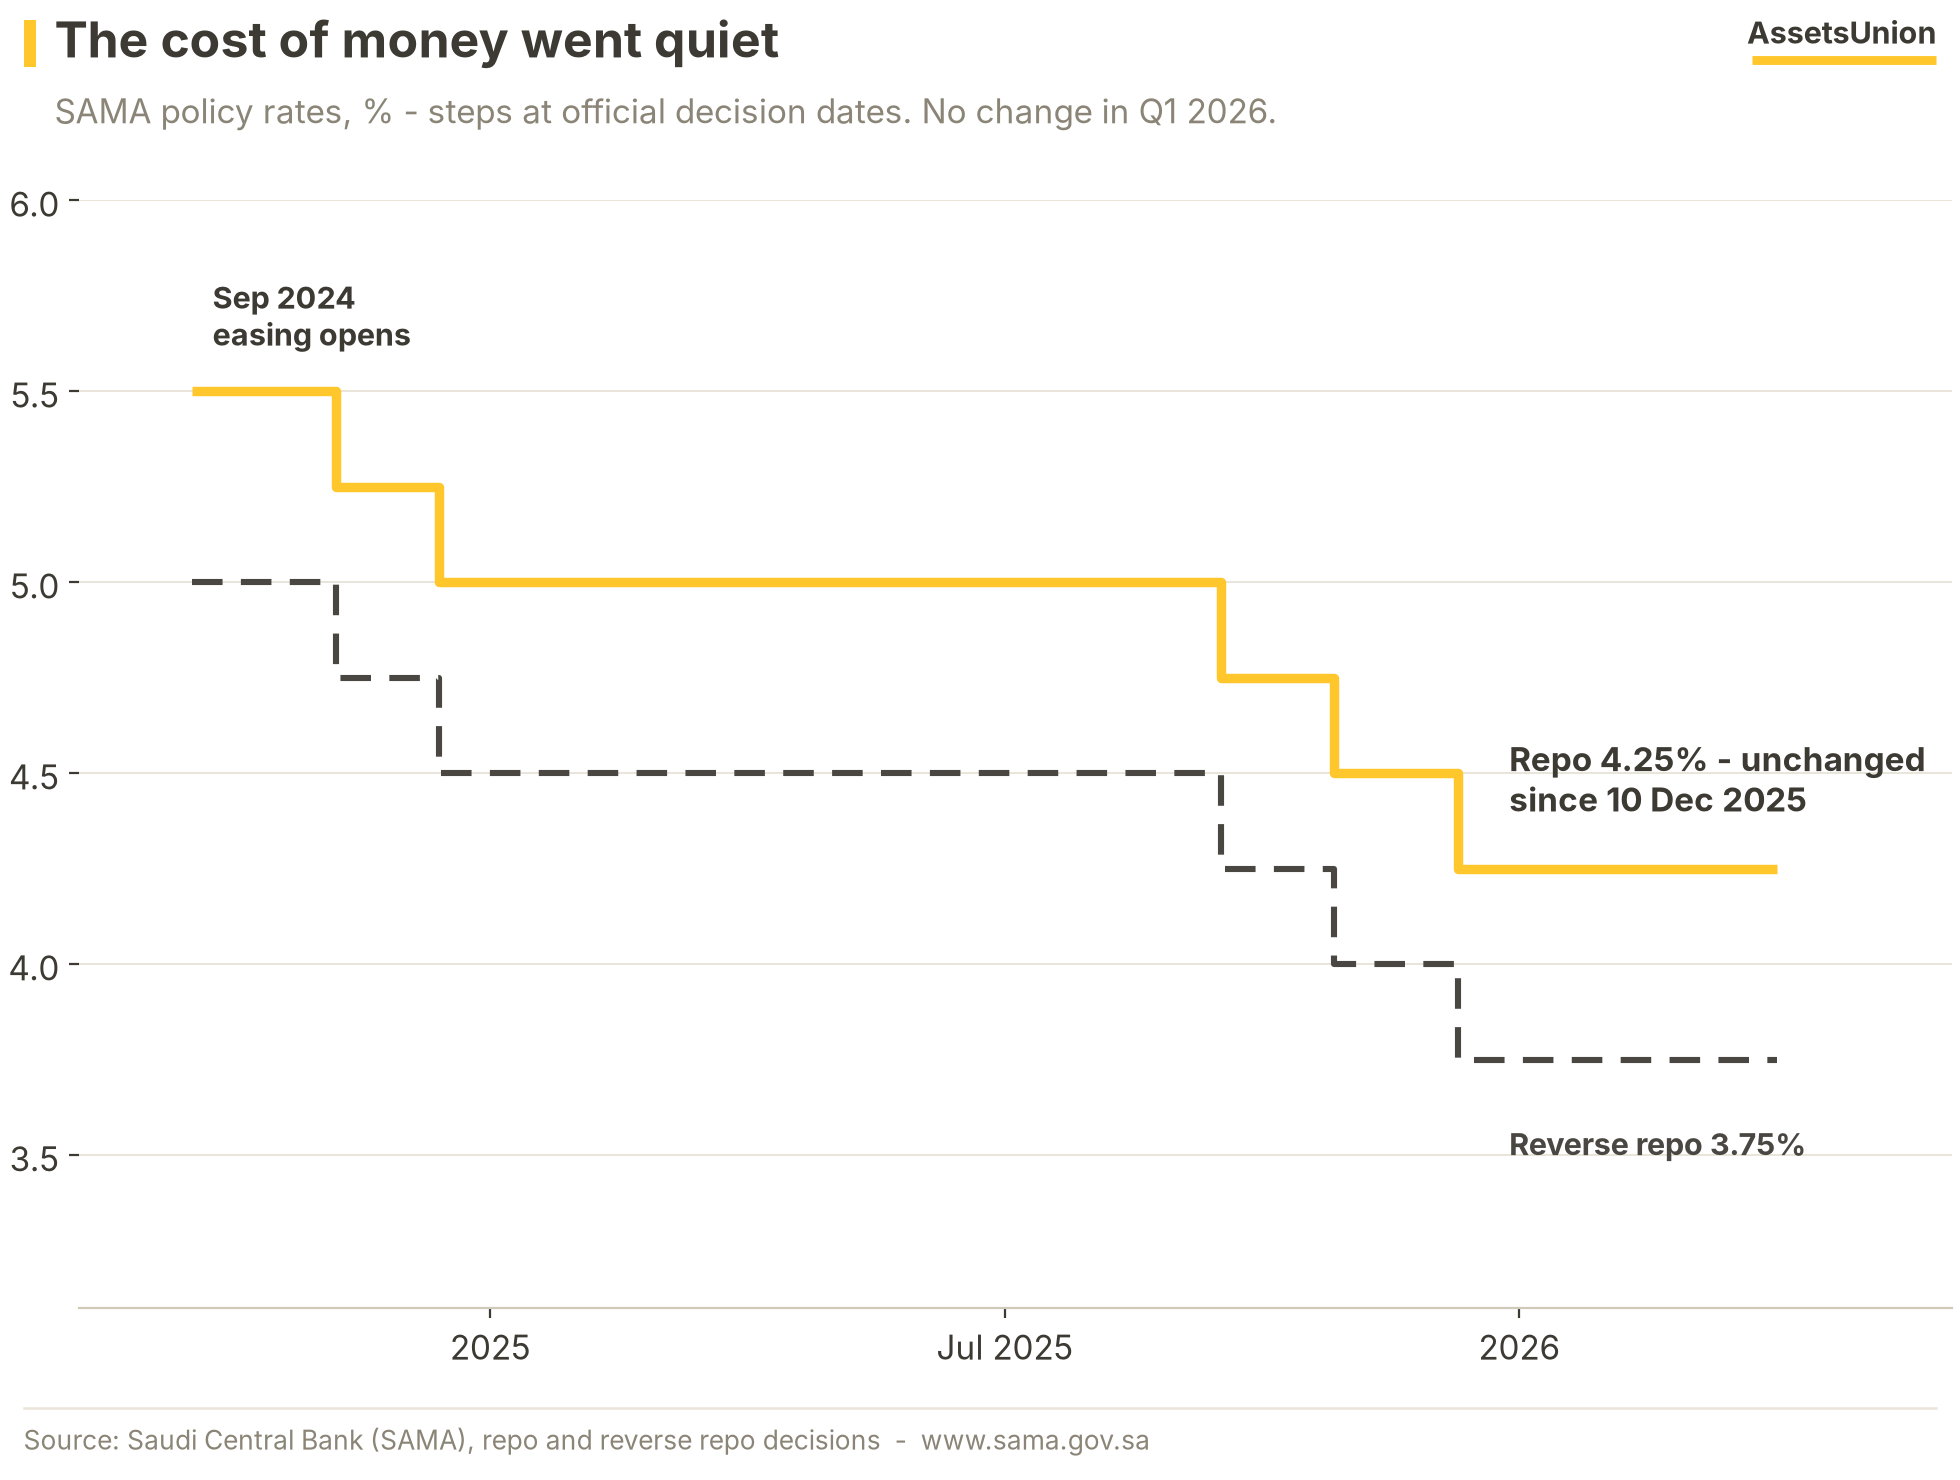
After three quarter-point cuts through late 2025, SAMA left the repo rate at 4.25% and the reverse repo rate at 3.75% throughout Q1 2026, mirroring a Federal Reserve that held its target range at every meeting of the quarter under the riyal's dollar peg. The 2025 lesson still applies: easing alone did not reignite mortgage demand, and a hold will not extinguish it. The binding constraints remain affordability and price expectations - which is why the foreign-demand channel opened by January's law matters more to the 2026 outlook than the next 25 basis points.
Listed Real Estate Turned First
After 17 of 19 REITs fell in 2025, 12 of 19 rose in Q1 2026 - the fastest price-discovery mechanism has changed direction.
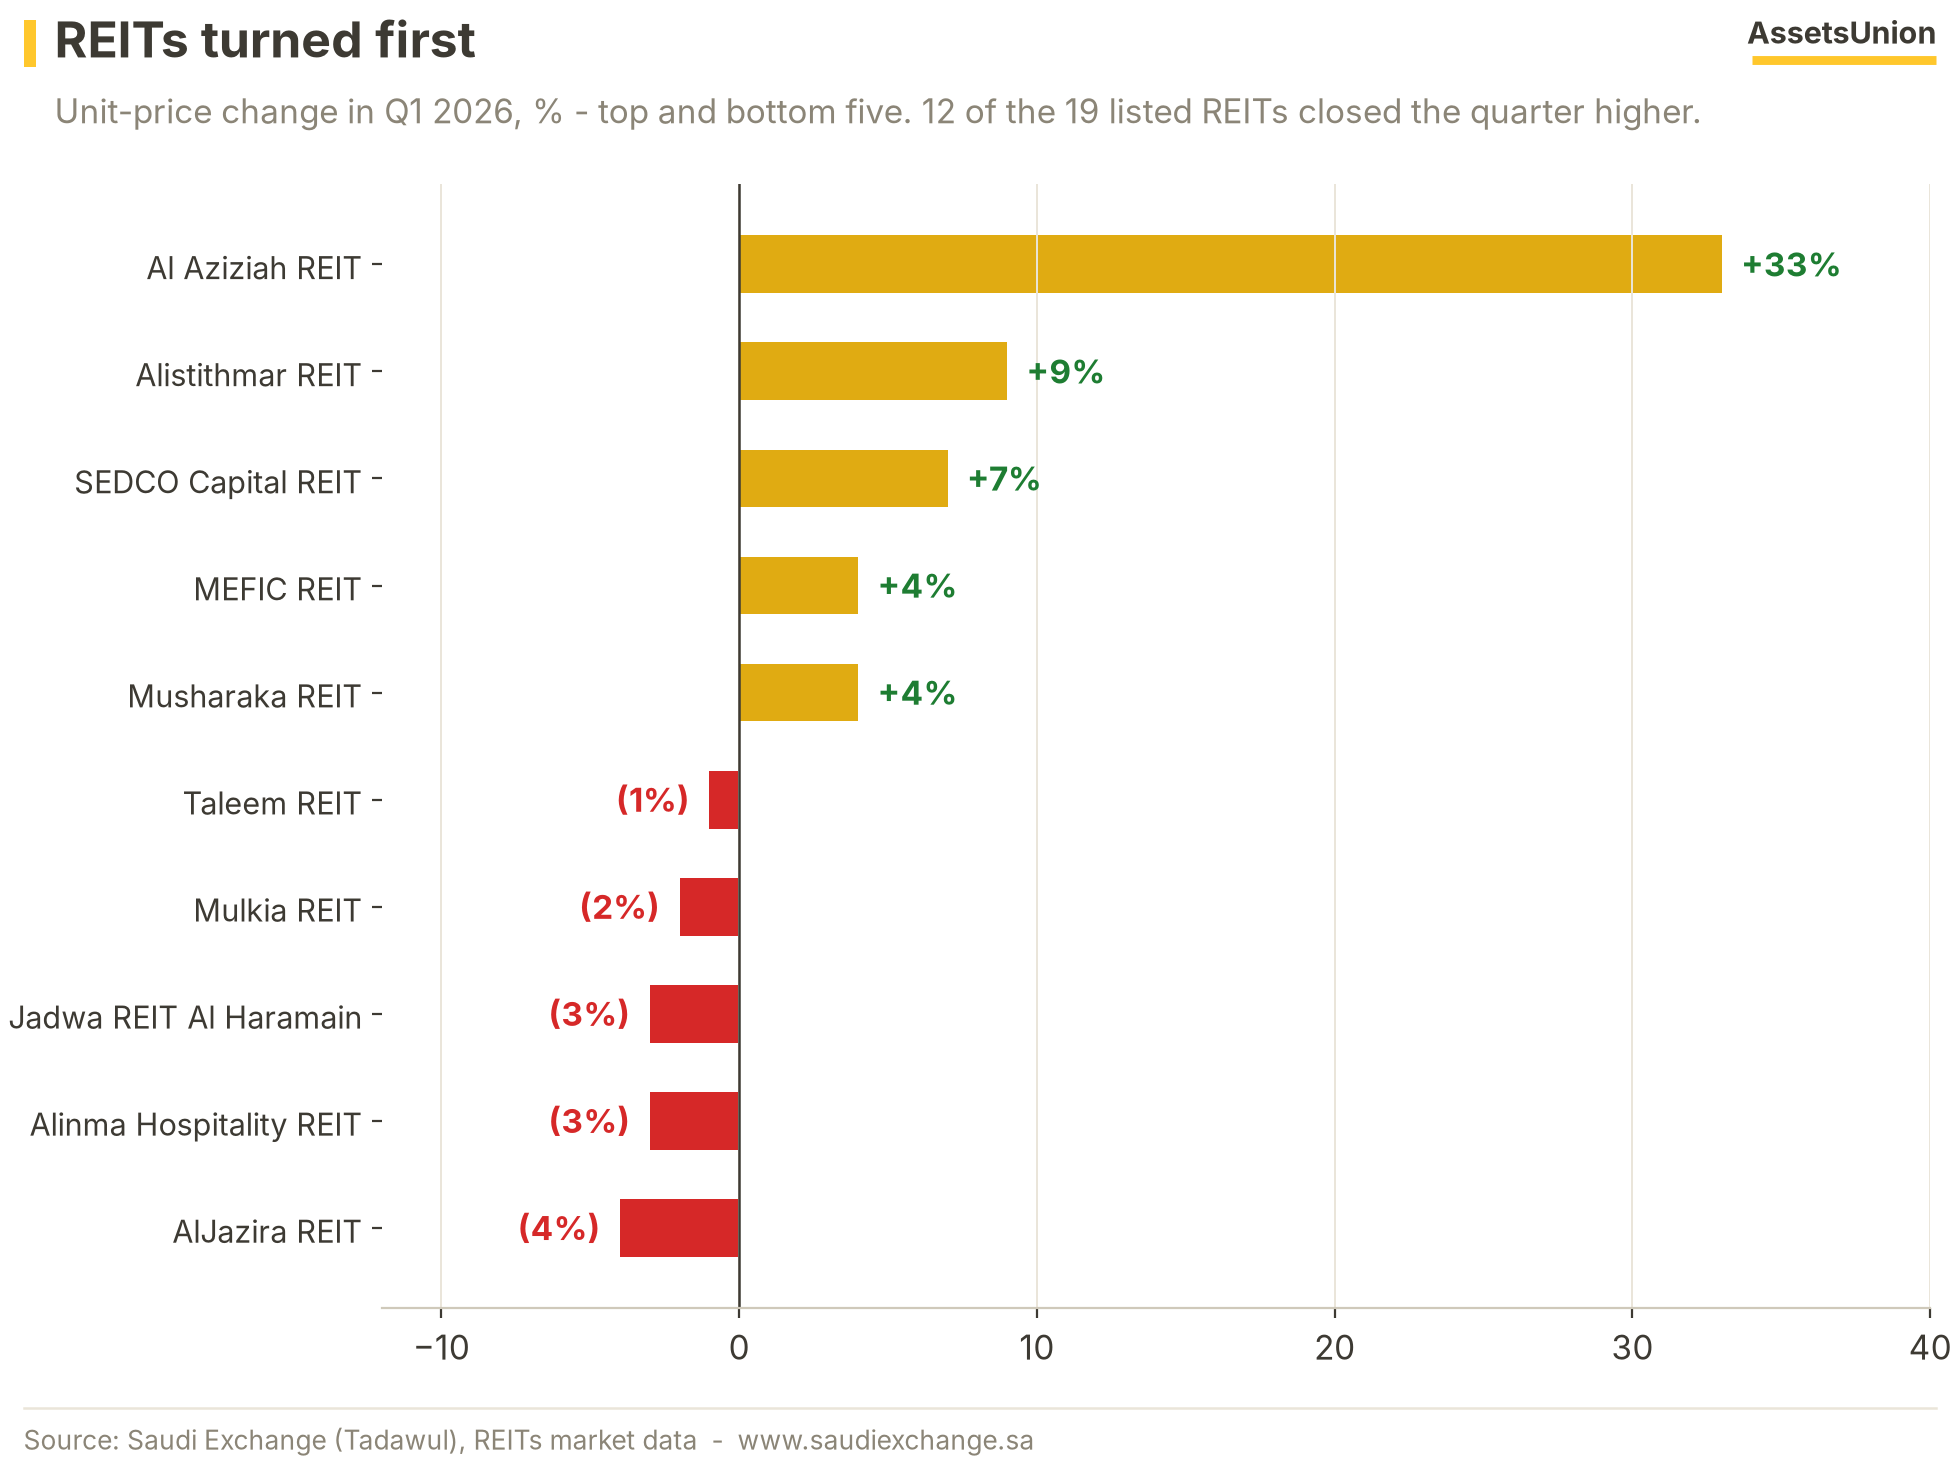
Al Aziziah REIT led at +33%, with Alistithmar (+9%) and SEDCO Capital (+7%) behind it; the worst decliner, AlJazira REIT, lost only (4%) - a dramatic narrowing from 2025's (27%) tail. The sector index added +2% to 2,977 while TASI rose +7.2% to 11,250, its best quarter since 2023, helped by February's opening of the market to all foreign investors. One operating caveat keeps the rally honest: average REIT occupancy slipped to 91.2% from 92.1% a year earlier - the equity turn is running ahead of the leasing data, not behind it.
How Q2 Opened
April matched its year-ago print for the first non-decline in eleven months; May relapsed. The floor is forming, unevenly.
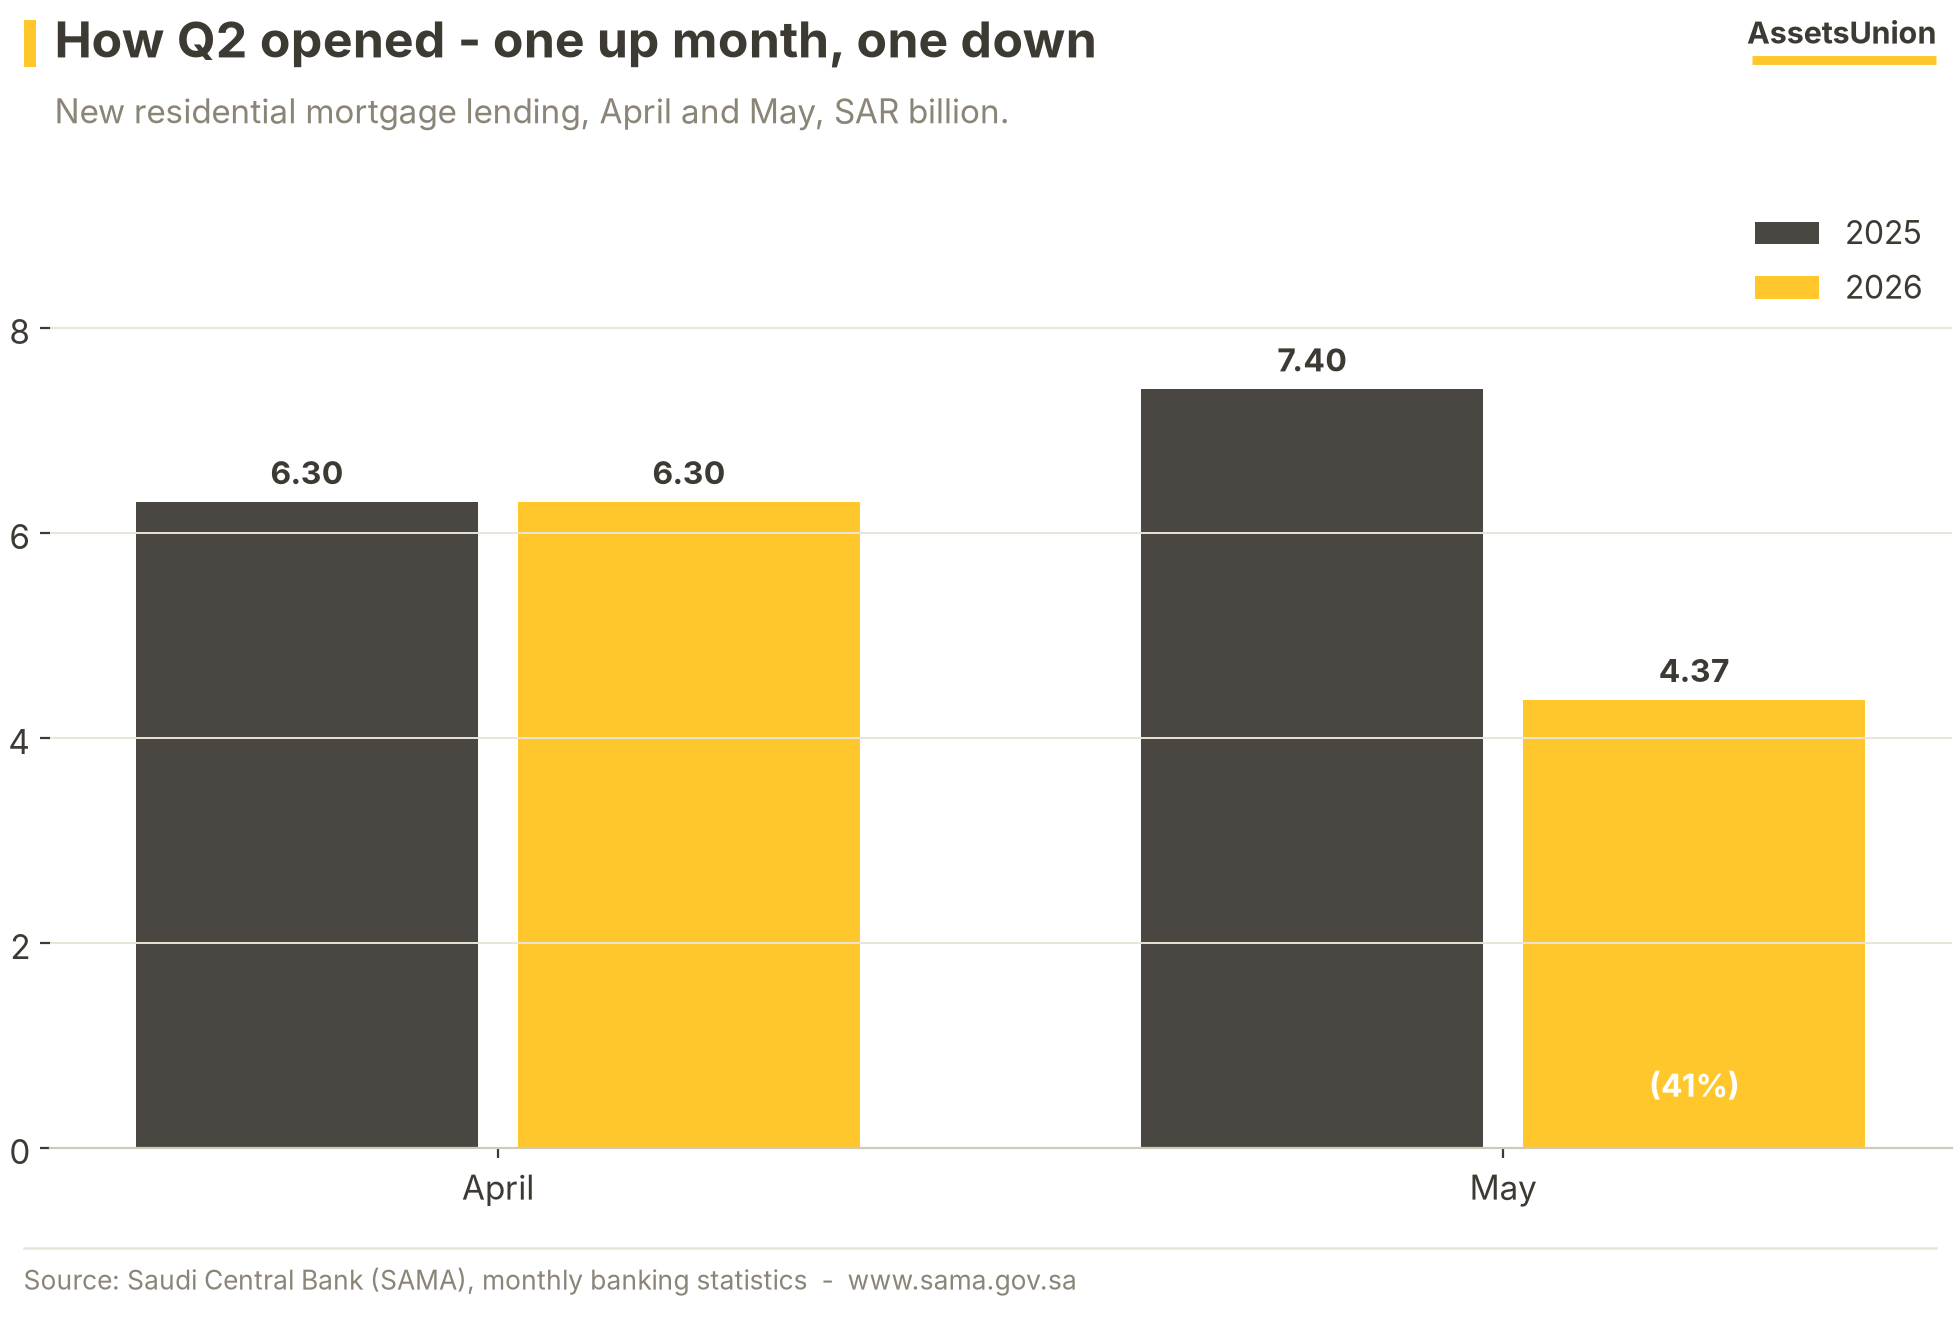
April 2026 wrote SAR 6.30 billion - level with April 2025 and the first month since mid-2025 not to post a year-on-year decline. May answered with SAR 4.37 billion ((41%)), a reminder that one flat month is not a trend. The early Q2 read: the market is testing a floor rather than lifting off it. June's print - due from SAMA on 30 July - and the first data from the designated foreign-ownership zones approved on 23 June will decide which way the second-quarter edition of this report leans.
What We Are Watching
What we are tracking for Q2 2026 - the conditions we watch in every issue and what would change the picture.
| Base path | What would improve it | What would worsen it | |
|---|---|---|---|
| Lending | Q2 hovers near the SAR 15B quarterly run-rate; YoY gaps narrow on the weaker 2025 base | June print above SAR 6B, confirming April rather than May | A second sub-SAR 4.5B month |
| Prices | Residential REPI stays negative through mid-2026; commercial holds positive | Riyadh's decline stabilising inside (5%) | Commercial joining residential in decline |
| Policy | Designated zones operational through H2; REGA platform live | Early foreign transactions clearing in Riyadh and Jeddah zones | Zone rollout or registry migration slipping |
| Rates | Repo holds at 4.25% while the US Federal Reserve stays paused | A resumed cutting cycle in H2 2026 | A hawkish turn repricing the peg |
Highlights
- New mortgage lending SAR 15.75B, (43%) YoY; March origination SAR 4.19B - lowest since April 2023
- Residential REPI (3.6%) YoY - a fourth quarter of decline; commercial +3.4%
- Land deals 21,320, (55%) YoY - the lowest on record
- SAMA held the repo rate at 4.25% all quarter
- TASI +7.2% to 11,250 - best quarter since 2023; 12 of 19 REITs higher; foreign-ownership law in force 21 January
Sources & Disclaimer
Sources
Disclaimer
This publication has been prepared by the Research Center of AssetsUnion, an independent research desk, and is issued for general information and non-commercial purposes only. It is not, and should not be construed as, an offer, solicitation, or recommendation to buy or sell any security, real-estate asset, or financial instrument, nor does it constitute investment, financial, legal, tax, or accounting advice of any kind. AssetsUnion is not licensed or supervised by the Saudi Capital Market Authority, and nothing herein constitutes a securities recommendation. AssetsUnion is likewise not licensed or supervised by the UAE Securities and Commodities Authority or the Dubai Financial Services Authority, and this publication is not directed at any person in any jurisdiction where its distribution would be unlawful. The information contained herein is drawn from official public sources believed to be reliable; AssetsUnion does not independently audit such information and makes no representation or warranty, express or implied, as to its accuracy, completeness, or fitness for any purpose. Figures, estimates, and opinions relate to the periods stated and are subject to change without notice. Past performance is not a reliable indicator of future results, and forward-looking statements involve risks and uncertainties. Neither AssetsUnion nor its principals accept any liability for any direct, indirect, or consequential loss arising from the use of this publication or reliance on its contents. This publication may not be reproduced or redistributed, in whole or in part, for commercial purposes without prior written consent. Recipients should conduct their own due diligence and consult their own professional advisers before making any investment, financing, or real-estate decision.