Market Pulse — Q1 2026
2025 at a Glance
Housing finance normalised, prices followed, the stock market had its worst year in a decade - and the regulator kept building.
The Year in One Paragraph
2025 was the year Saudi housing finance normalised and prices followed. Bank mortgage origination fell 12% to SAR 80.4 billion, cooling from a strong Q1 to a November trough of SAR 4.47 billion. The official price index swung from +5.12% residential growth in Q1 to (2.24%) by Q4, and the equity market told the same tightening story: TASI closed at 10,490.69, down (12.84%) - its steepest annual fall in a decade, with 17 of the 19 listed REITs finishing lower - while SAMA ended the year easing, its repo rate at 4.25% after December's quarter-point cut. Against that, the structural story held: homeownership reached 66.24%, non-bank origination consolidated into the banking system, and the regulator escalated White Land fees to a 10% ceiling while the foreign-ownership law was readied for its January 2026 start.
Lending: The Twelve-Month Path
From SAR 10.5 billion in January to a SAR 4.47 billion November trough - the cooling was progressive, not a shock.
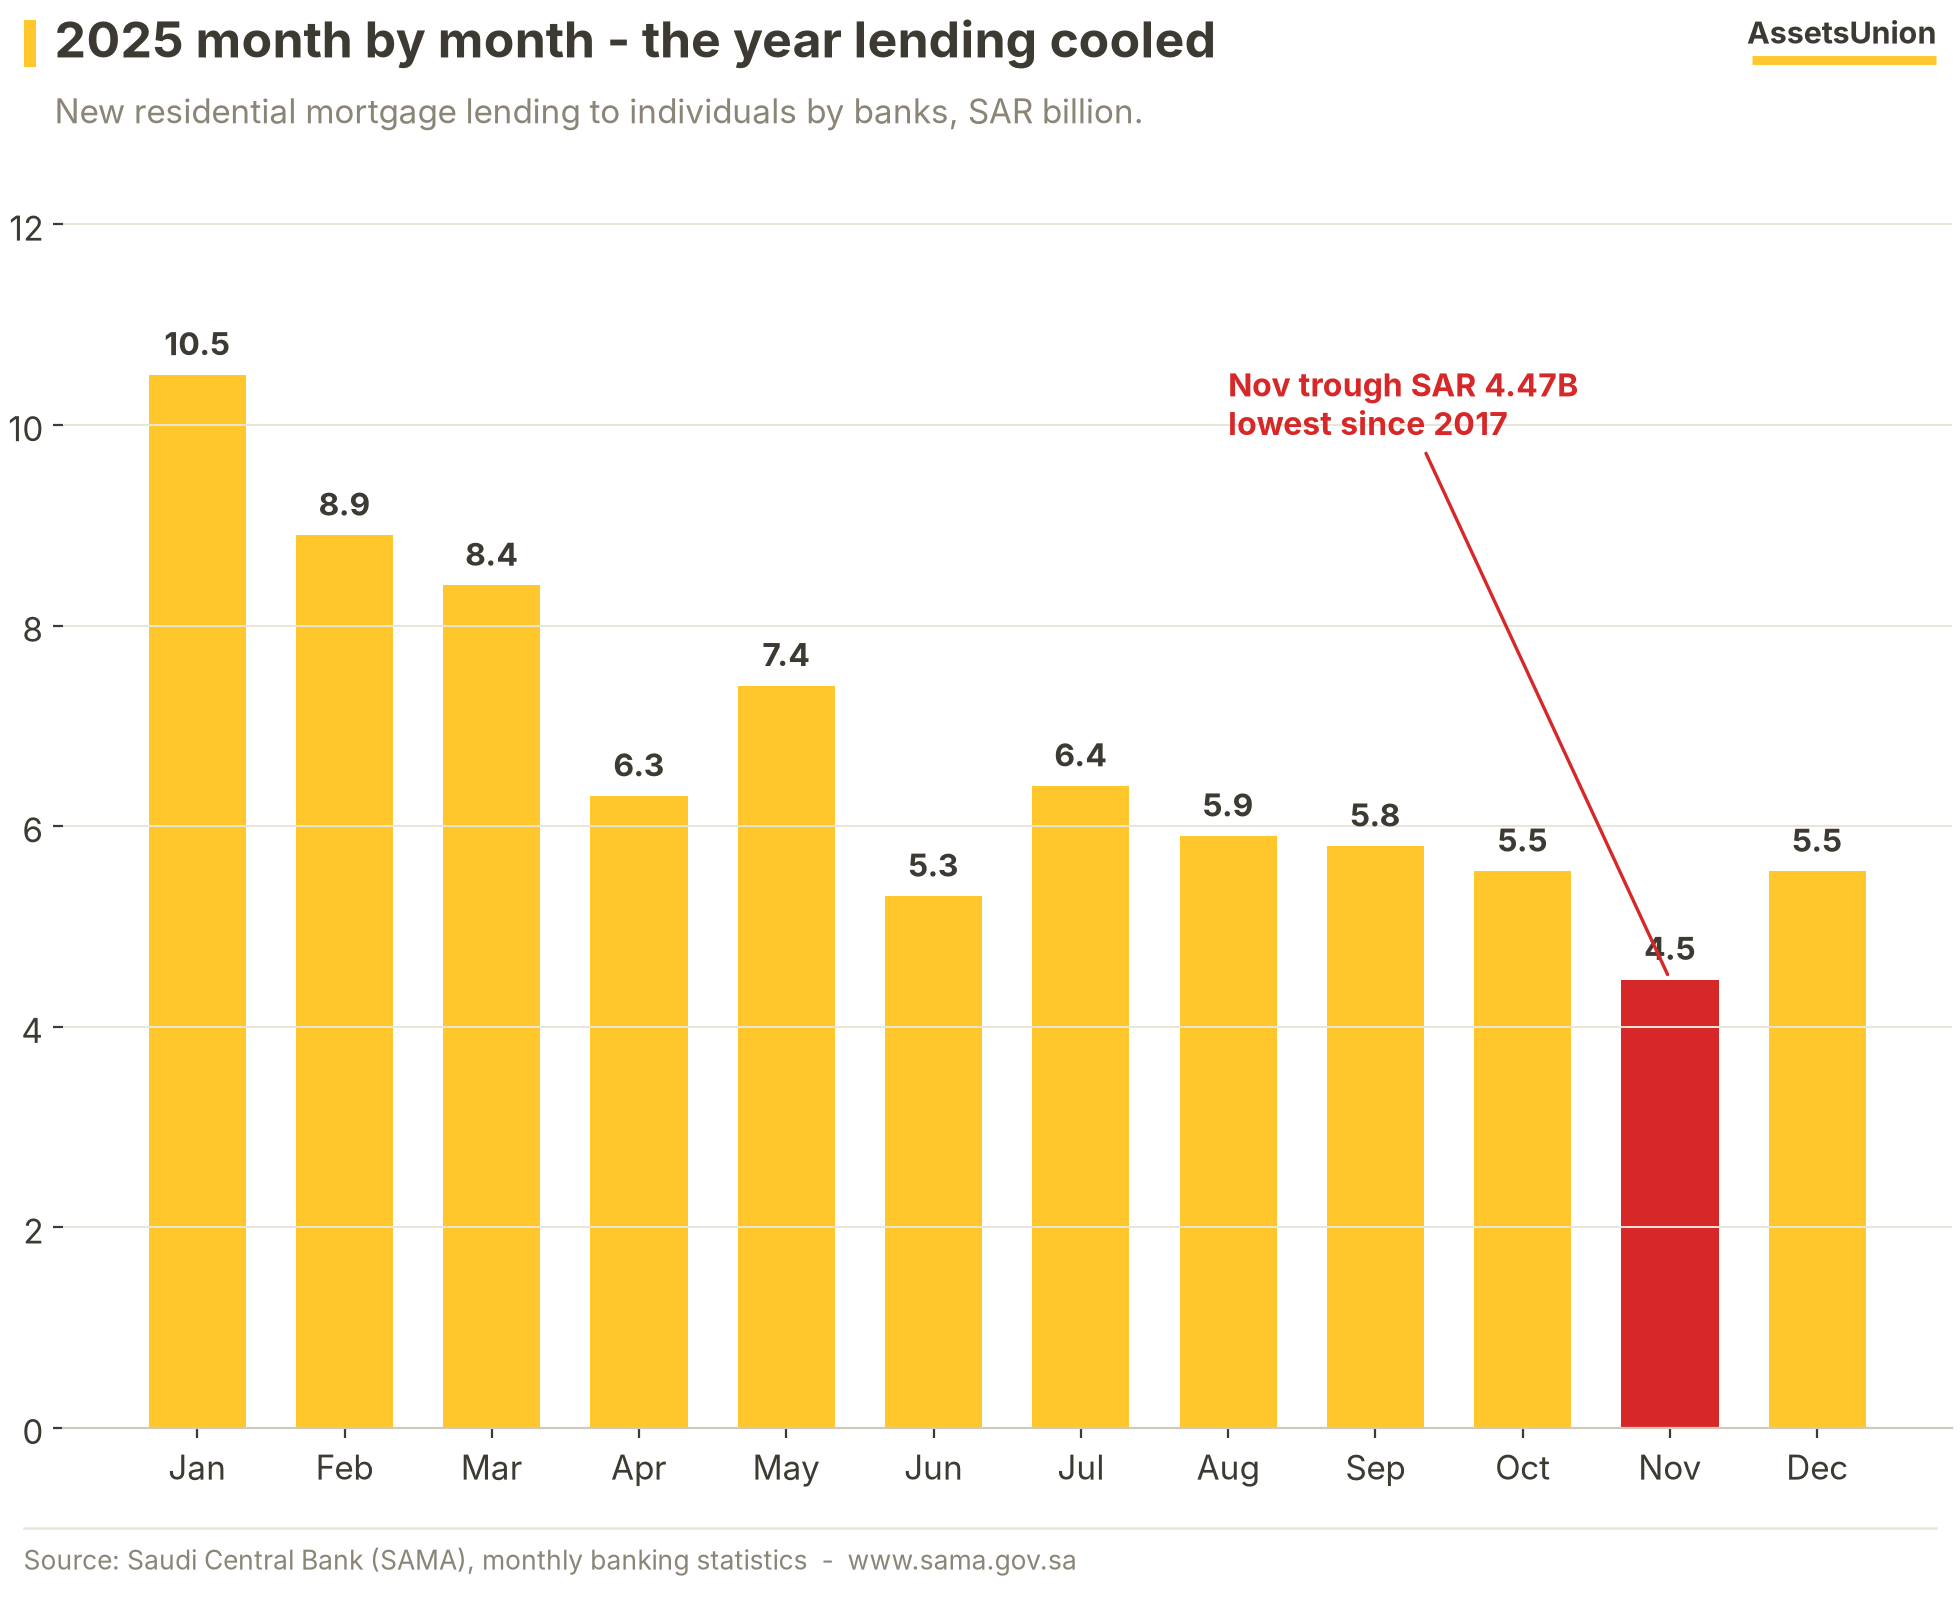
January opened at SAR 10.5 billion (+39% year on year) on the tail of the 2024 re-acceleration; by November origination had more than halved to SAR 4.47 billion, before a 24% month-on-month December bounce to SAR 5.55 billion. Year-on-year growth flipped negative in May and deepened every month through November - a full-year descent in which no single month broke the trend.
The Decade Context
2025 lands almost exactly on the 2019 level - a full round trip from the subsidised-mortgage boom.
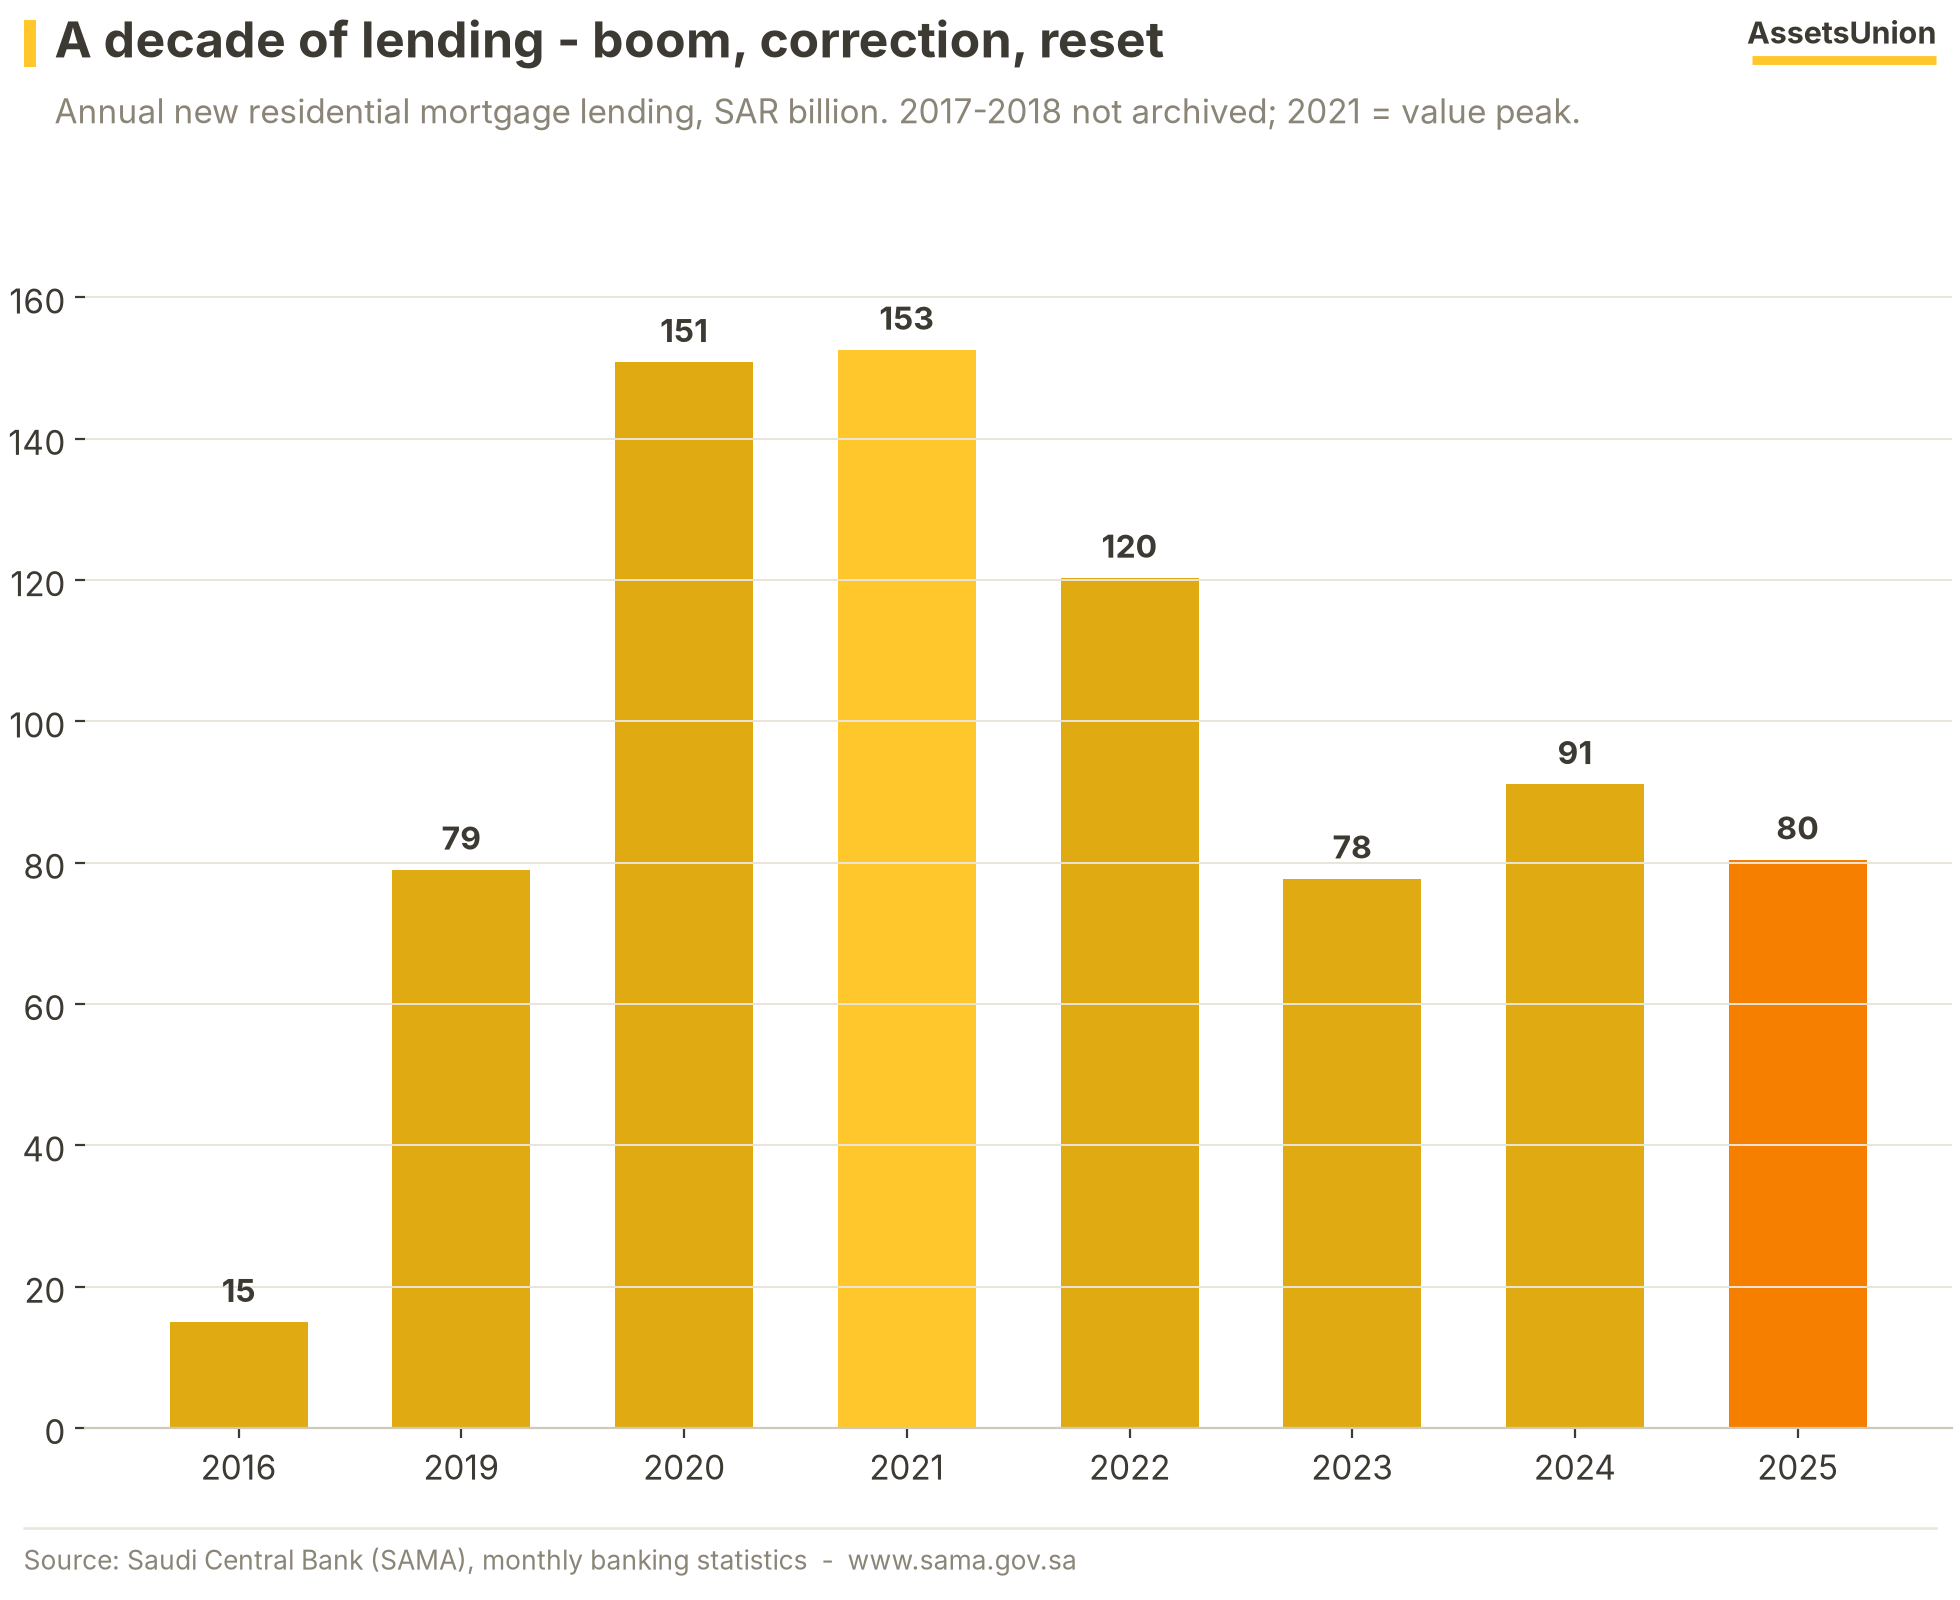
The boom peaked at SAR 152.5 billion of origination in 2021 - the value peak; 2020 holds the contract-count peak at 225,073. The 2023 trough, 2024 rebound and 2025 fade define a market now driven by affordability and rates rather than program-led catch-up. On the official series, the decade reads as one arc: ignition (2016-2019), boom (2020-2022), and a search for the new normal (2023-2025).
What the Money Bought
Villas kept nearly two thirds of lending value; land plots fell below 6%.
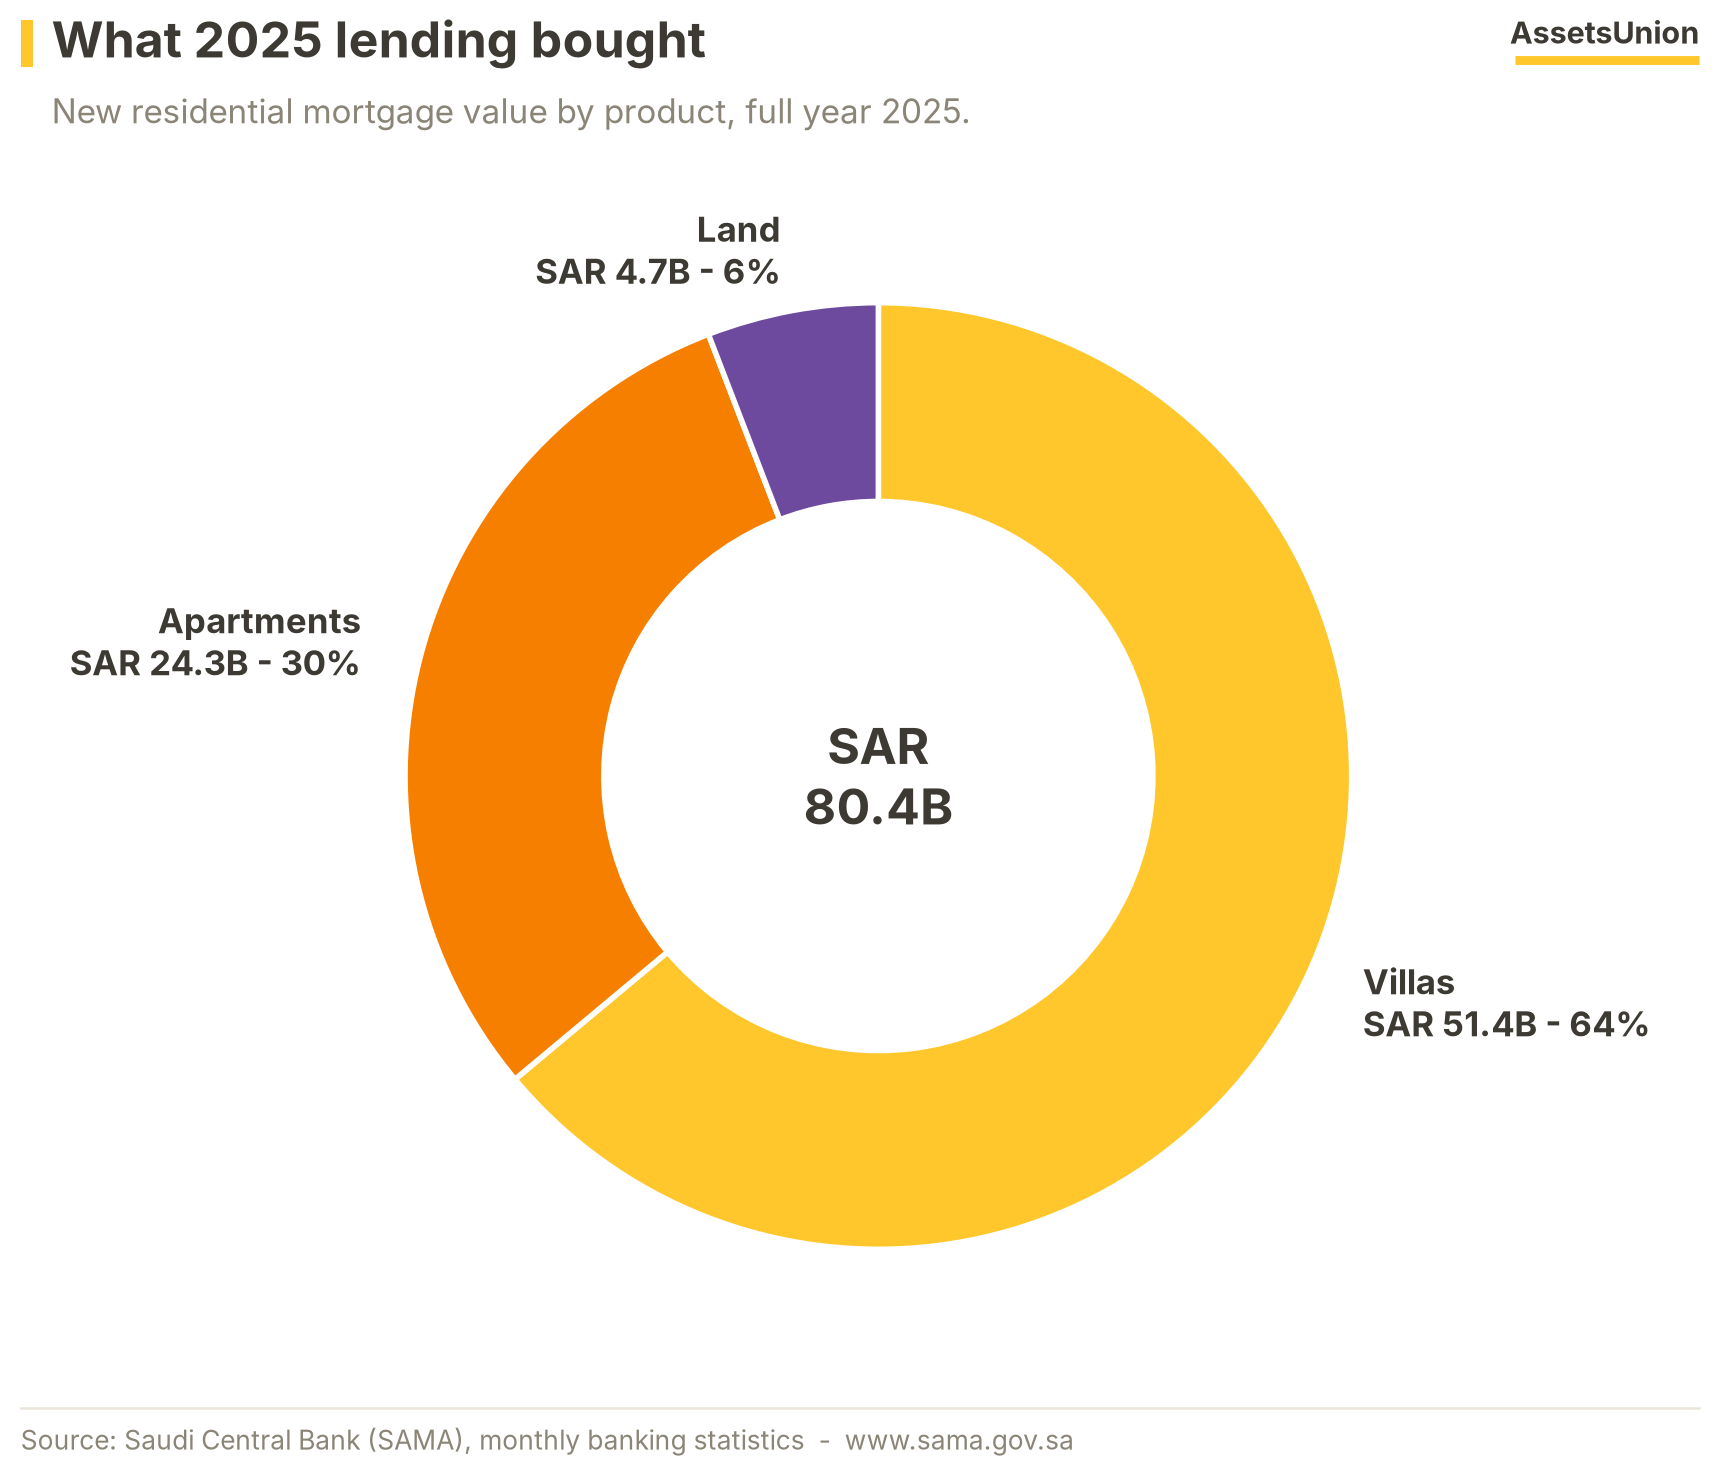
Villas took SAR 51.4 billion of 2025 lending value, apartments SAR 24.3 billion and land plots SAR 4.7 billion. The average mortgage slipped 1% to SAR 739,000. Non-bank financing companies wrote just SAR 2.49 billion - (3%) year on year - their weakest year in seven: consolidation of origination inside the banking system is effectively complete.
Prices: From +5 to -2 in Four Quarters
The official index tells a clean rollover story - positive momentum spent by mid-year, negative by Q3.
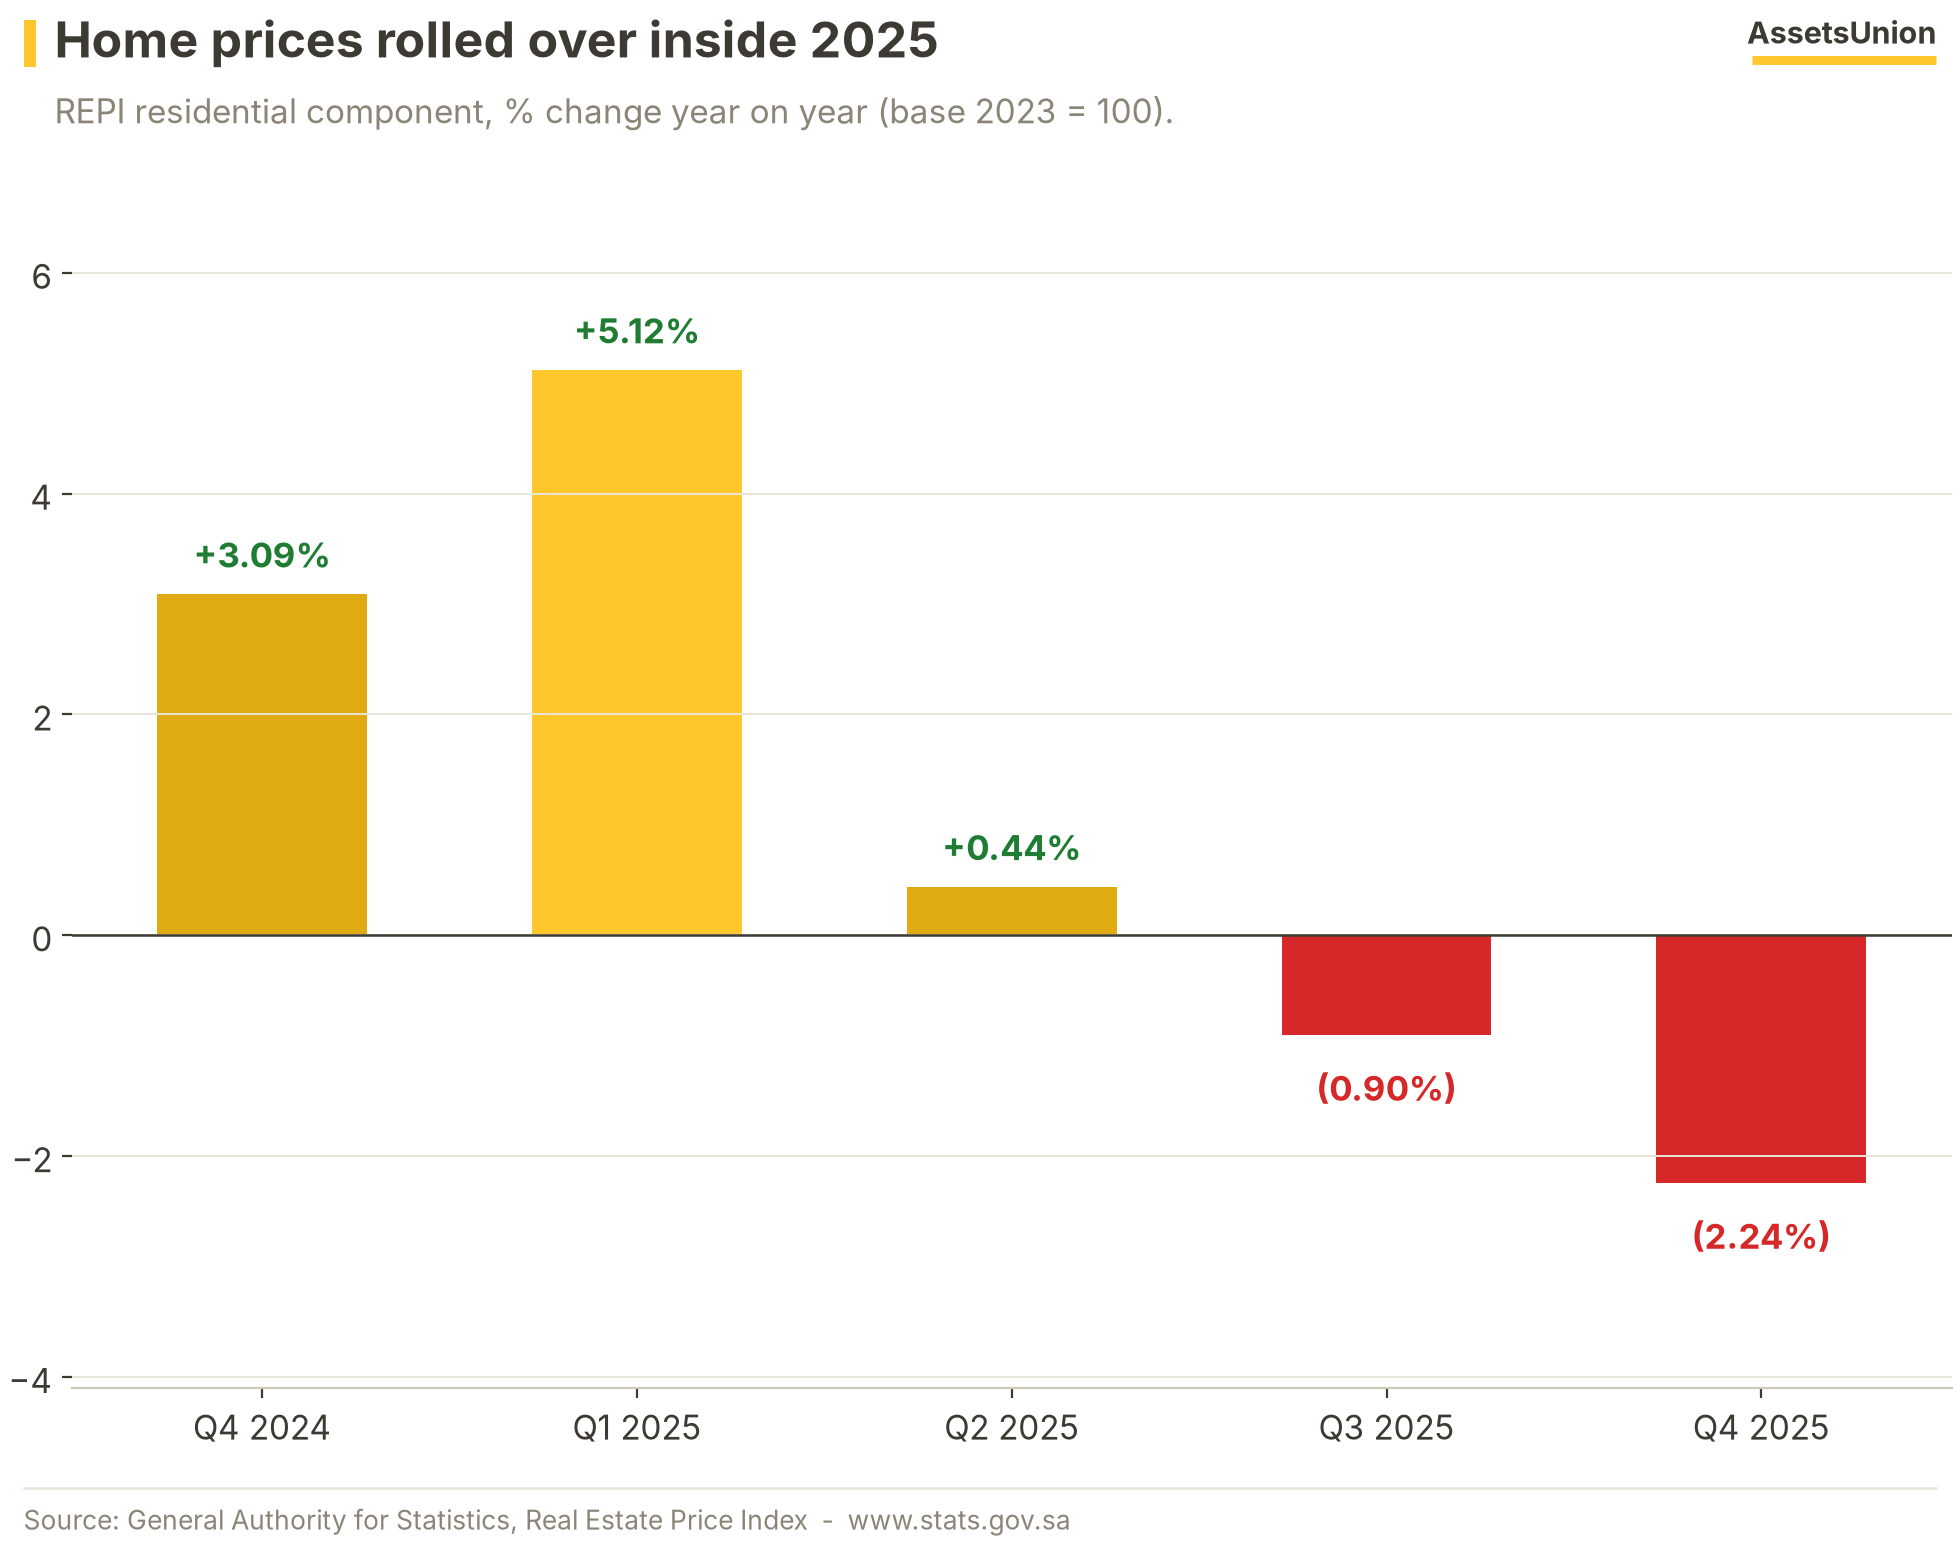
Residential inflation of +5.12% year on year in Q1 2025 faded to +0.44% by Q2, went negative in Q3 and ended the year at (2.24%). Note the series break: GaStat rebased the REPI at Q3 2024 with a geospatial methodology (base 2023 = 100), so pre-2024 prints are a different vintage and are not spliced into this chart.
Inside the Q4 Print
Every residential segment closed 2025 in decline - the first broad national correction of the rebased-index era.
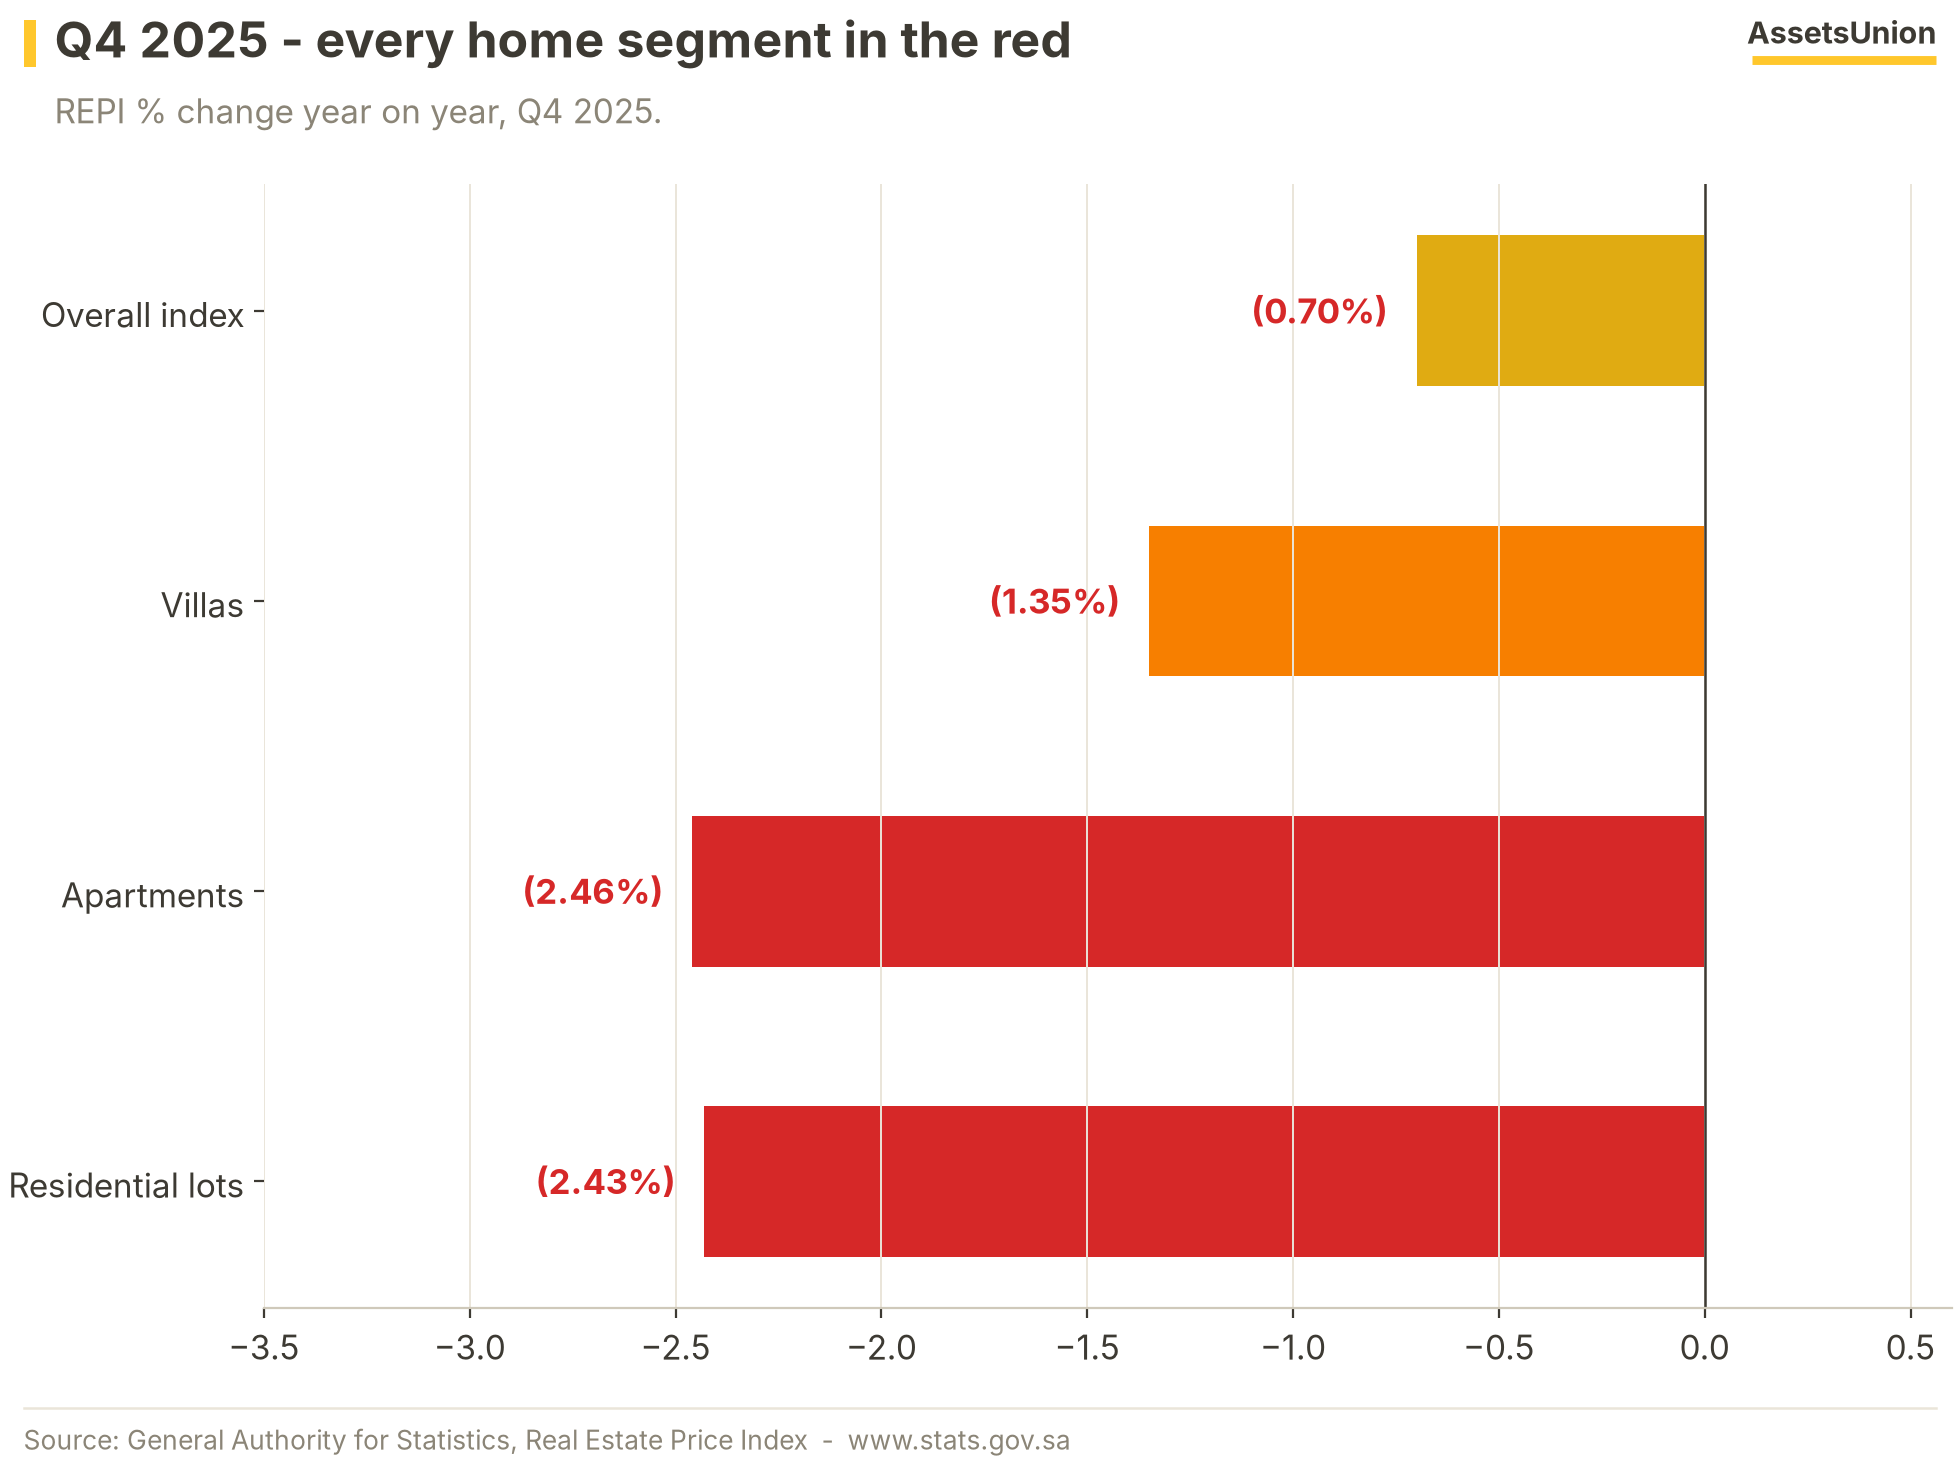
Apartments fell (2.46%), residential lots (2.43%) and villas (1.35%). The overall index, at (0.7%), was cushioned by non-residential components. The softness is broad-based rather than a single-city event - a genuine national price correction, arriving exactly as lending volumes found their floor.
The Structural Engine
Homeownership advanced again to 66.24% - four points from the Vision 2030 target.
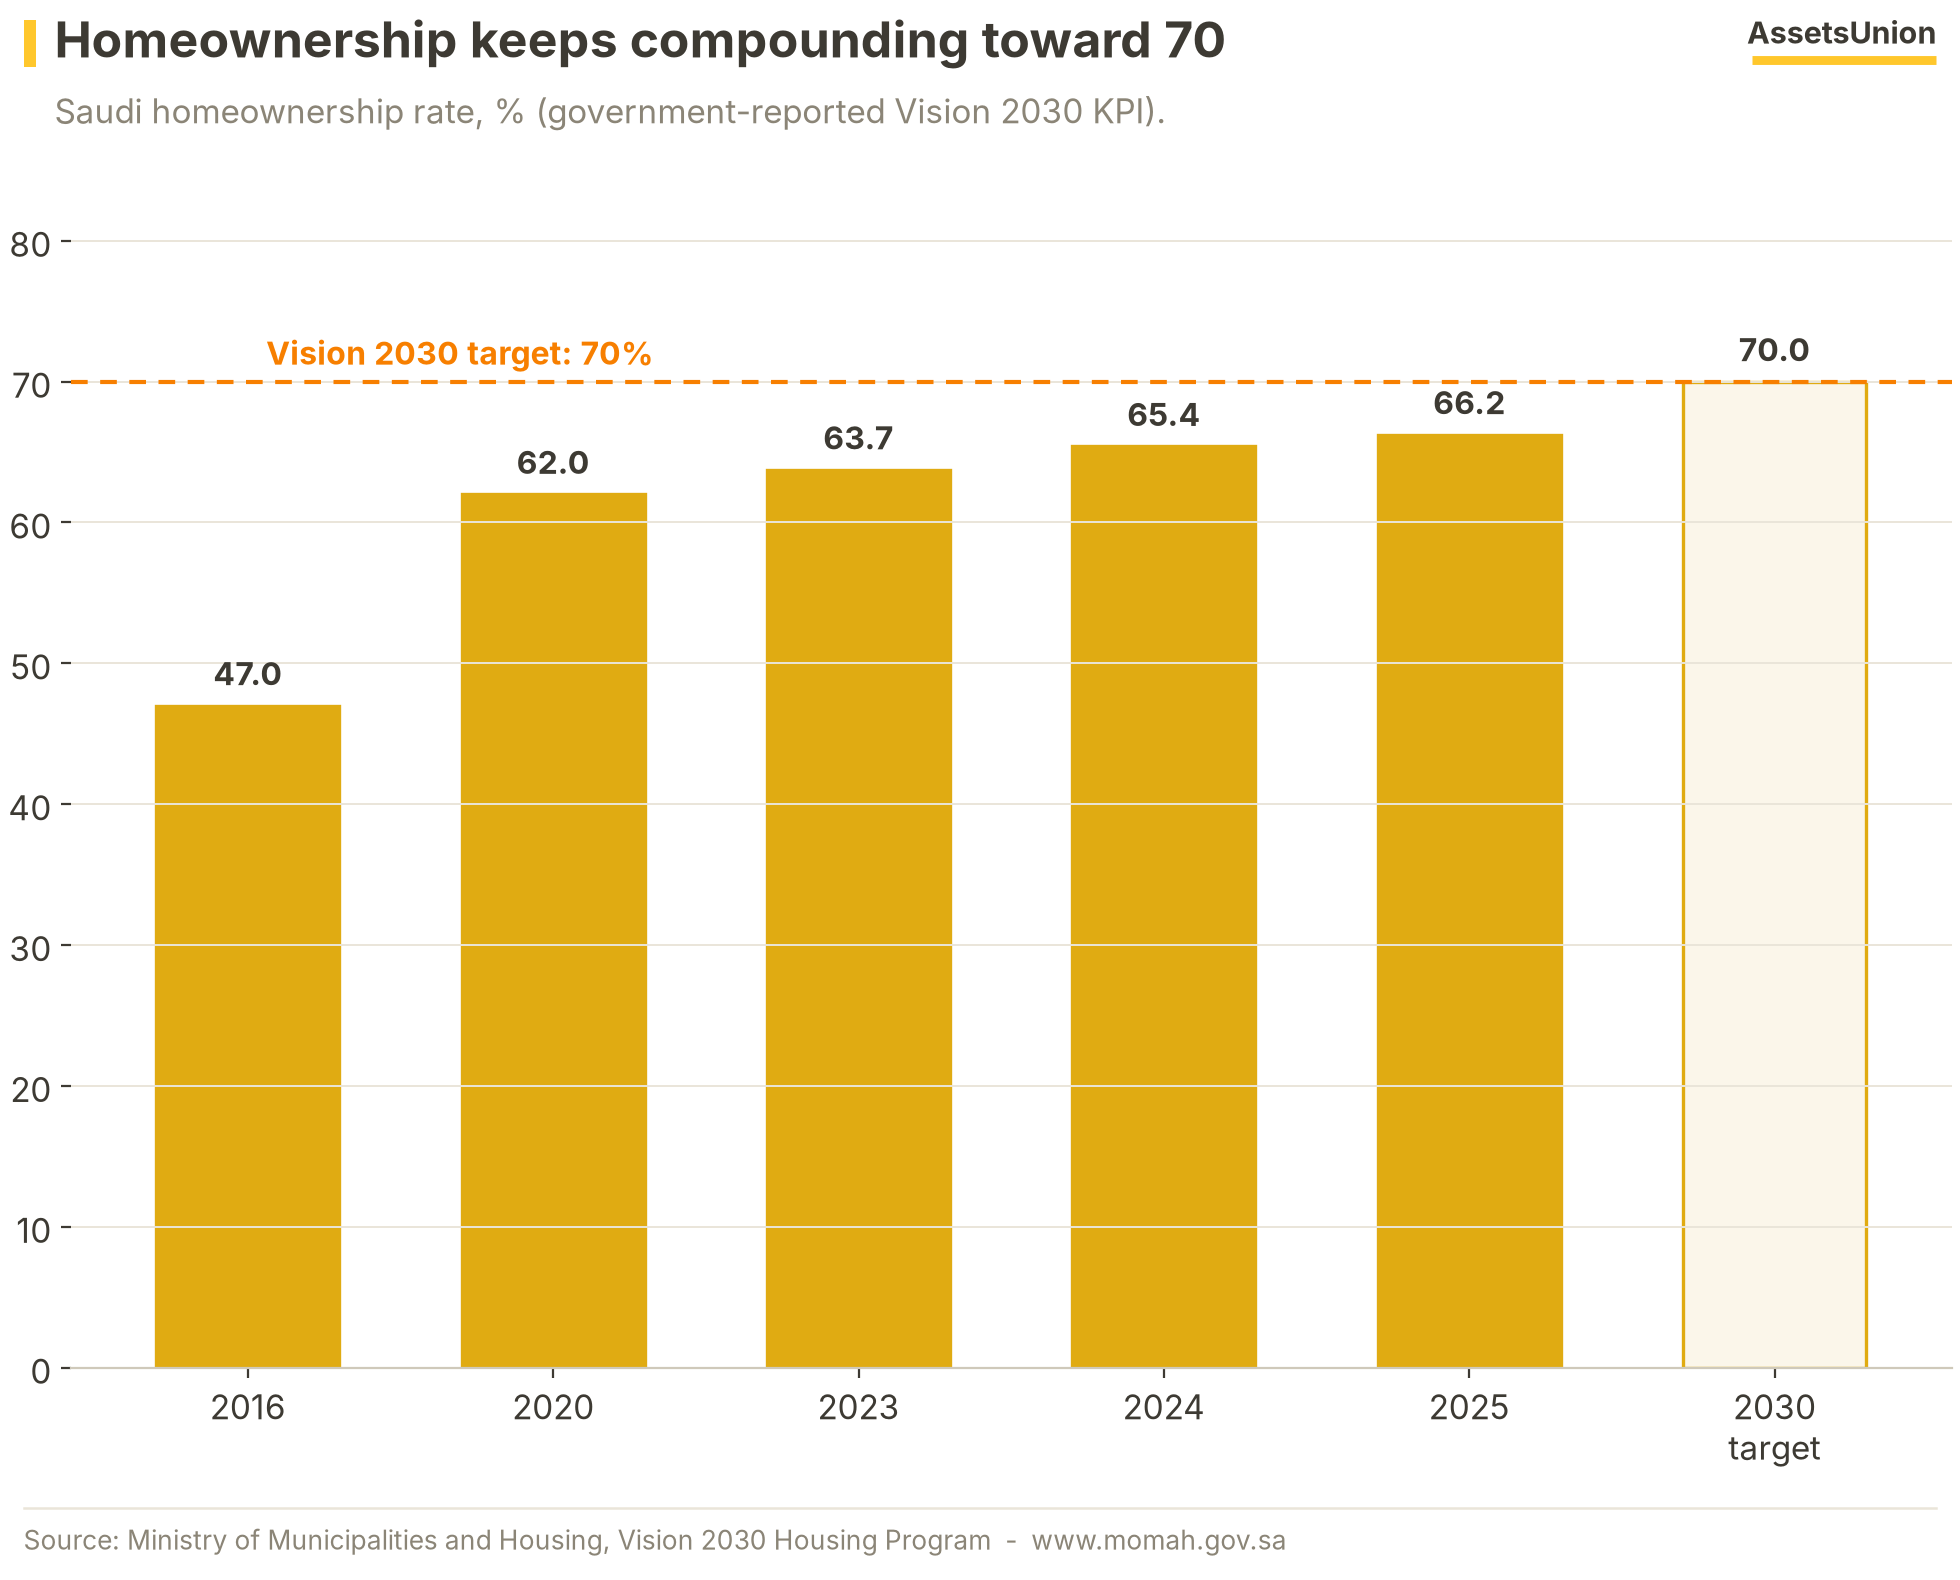
Homeownership - the Vision 2030 flagship housing KPI - has climbed from a 47% baseline in 2016 to 66.24% in 2025. These figures are government-reported program KPIs, best read as policy milestones rather than independent market measurements. Their direction, not their decimal, is the signal: the structural demand engine behind Saudi housing remains fully in place through the cyclical cooling.
Regulation: The Busiest Year Yet
Three structural rule changes landed in 2025 alone - tax, land-holding cost, and market access.
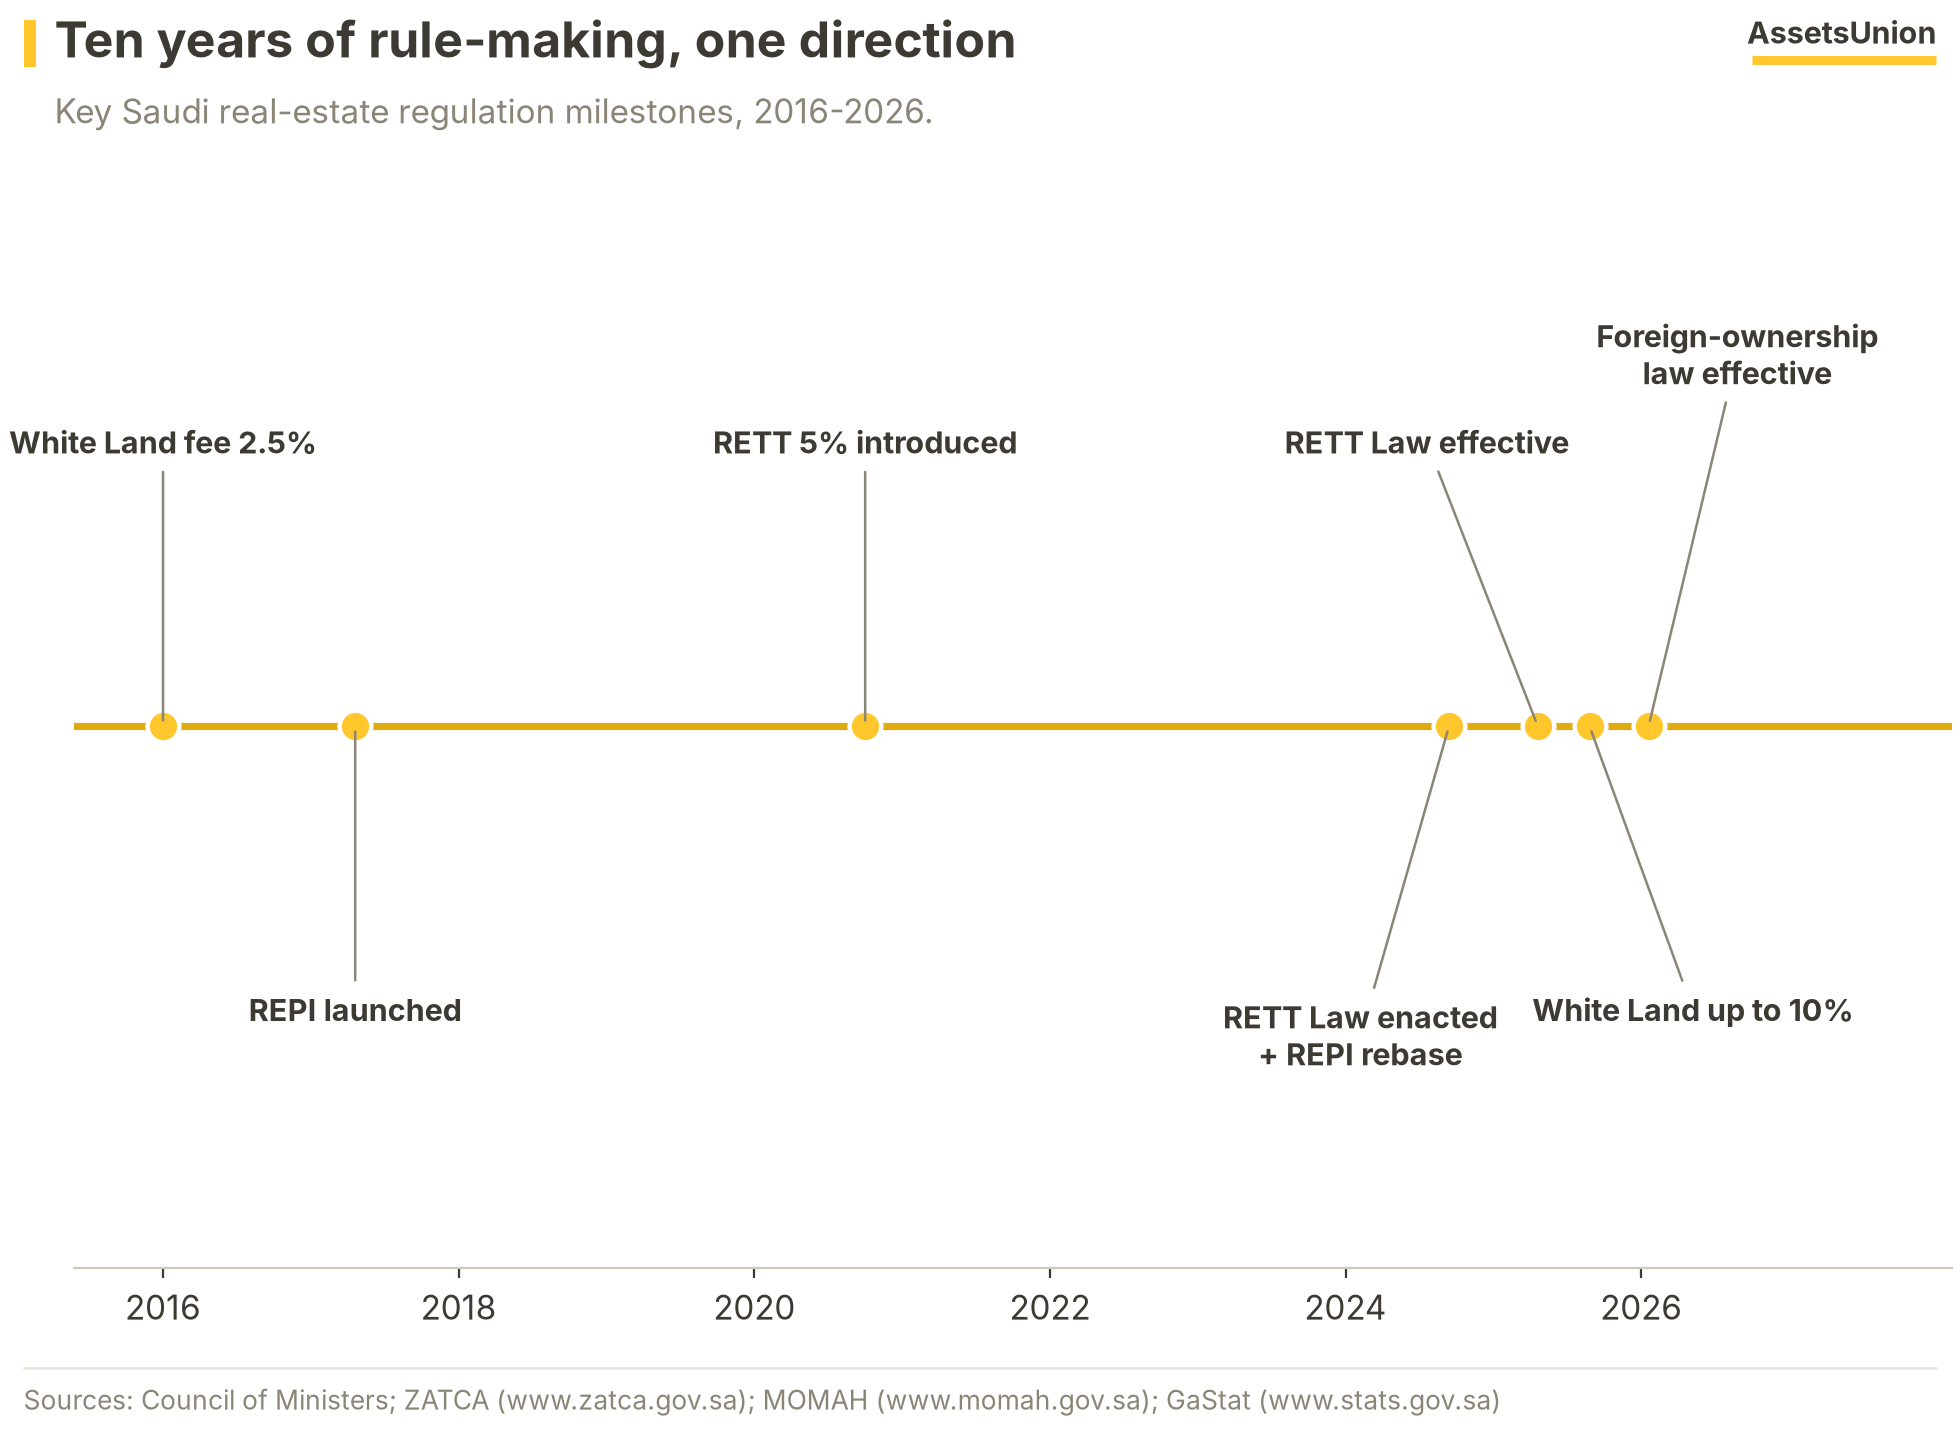
RETT Law effective 10 April 2025 - the 2020 5% transaction tax moved onto a standalone statute with codified exemptions (inheritance, family gifts, mergers, court-ordered sales). White Land fees escalated 22 August 2025 - up to 10% annually in four tiers, ownership threshold tightened to 5,000 sqm aggregated per city. Foreign-ownership law approved July 2025, in force January 2026 - designated-zone regulations roll out through 2026.
The Cost of Money
Twelve months of easing: from a two-decade-high 6% to 4.25% - and the mortgage market has yet to feel it.
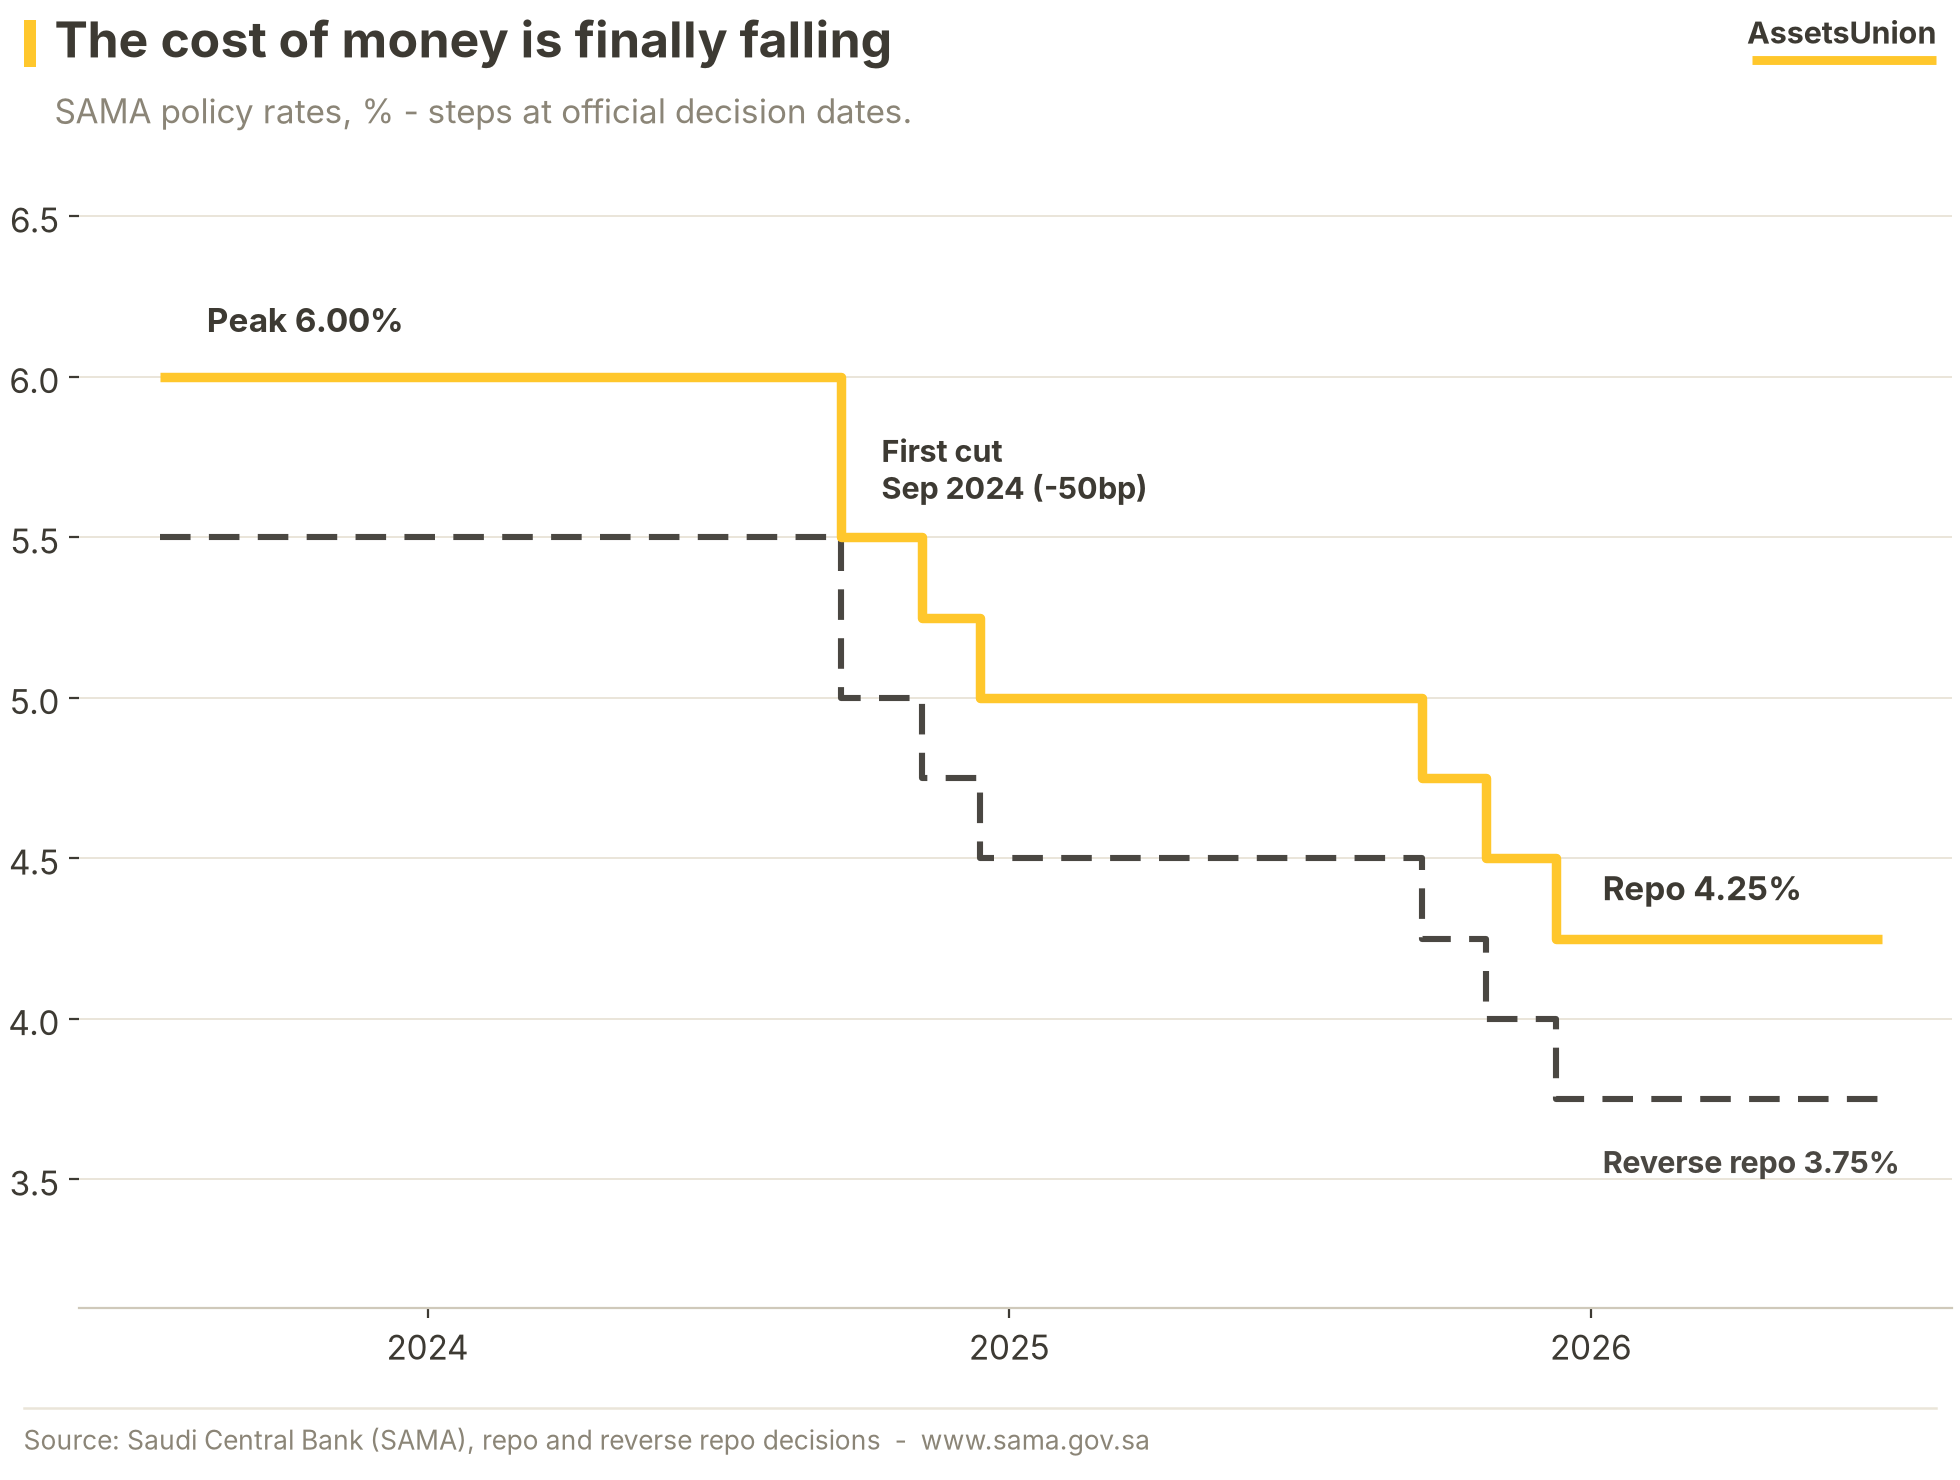
SAMA's repo rate sat at 6.00% from July 2023 through September 2024, when the easing cycle opened with a half-point cut. Three quarter-point steps followed in 2025 - September, October and December - taking the repo rate to 4.25% and the reverse repo rate to 3.75%, in step with the US Federal Reserve under the riyal's dollar peg. The transmission gap is the story of the year: lending kept cooling through 2025 even as policy eased, a reminder that affordability and price expectations, not the policy rate alone, are the market's binding constraints.
The Transaction Ledger
The Ministry of Justice ledger shows the reset extending into 2026 - value halved, volumes down a quarter.
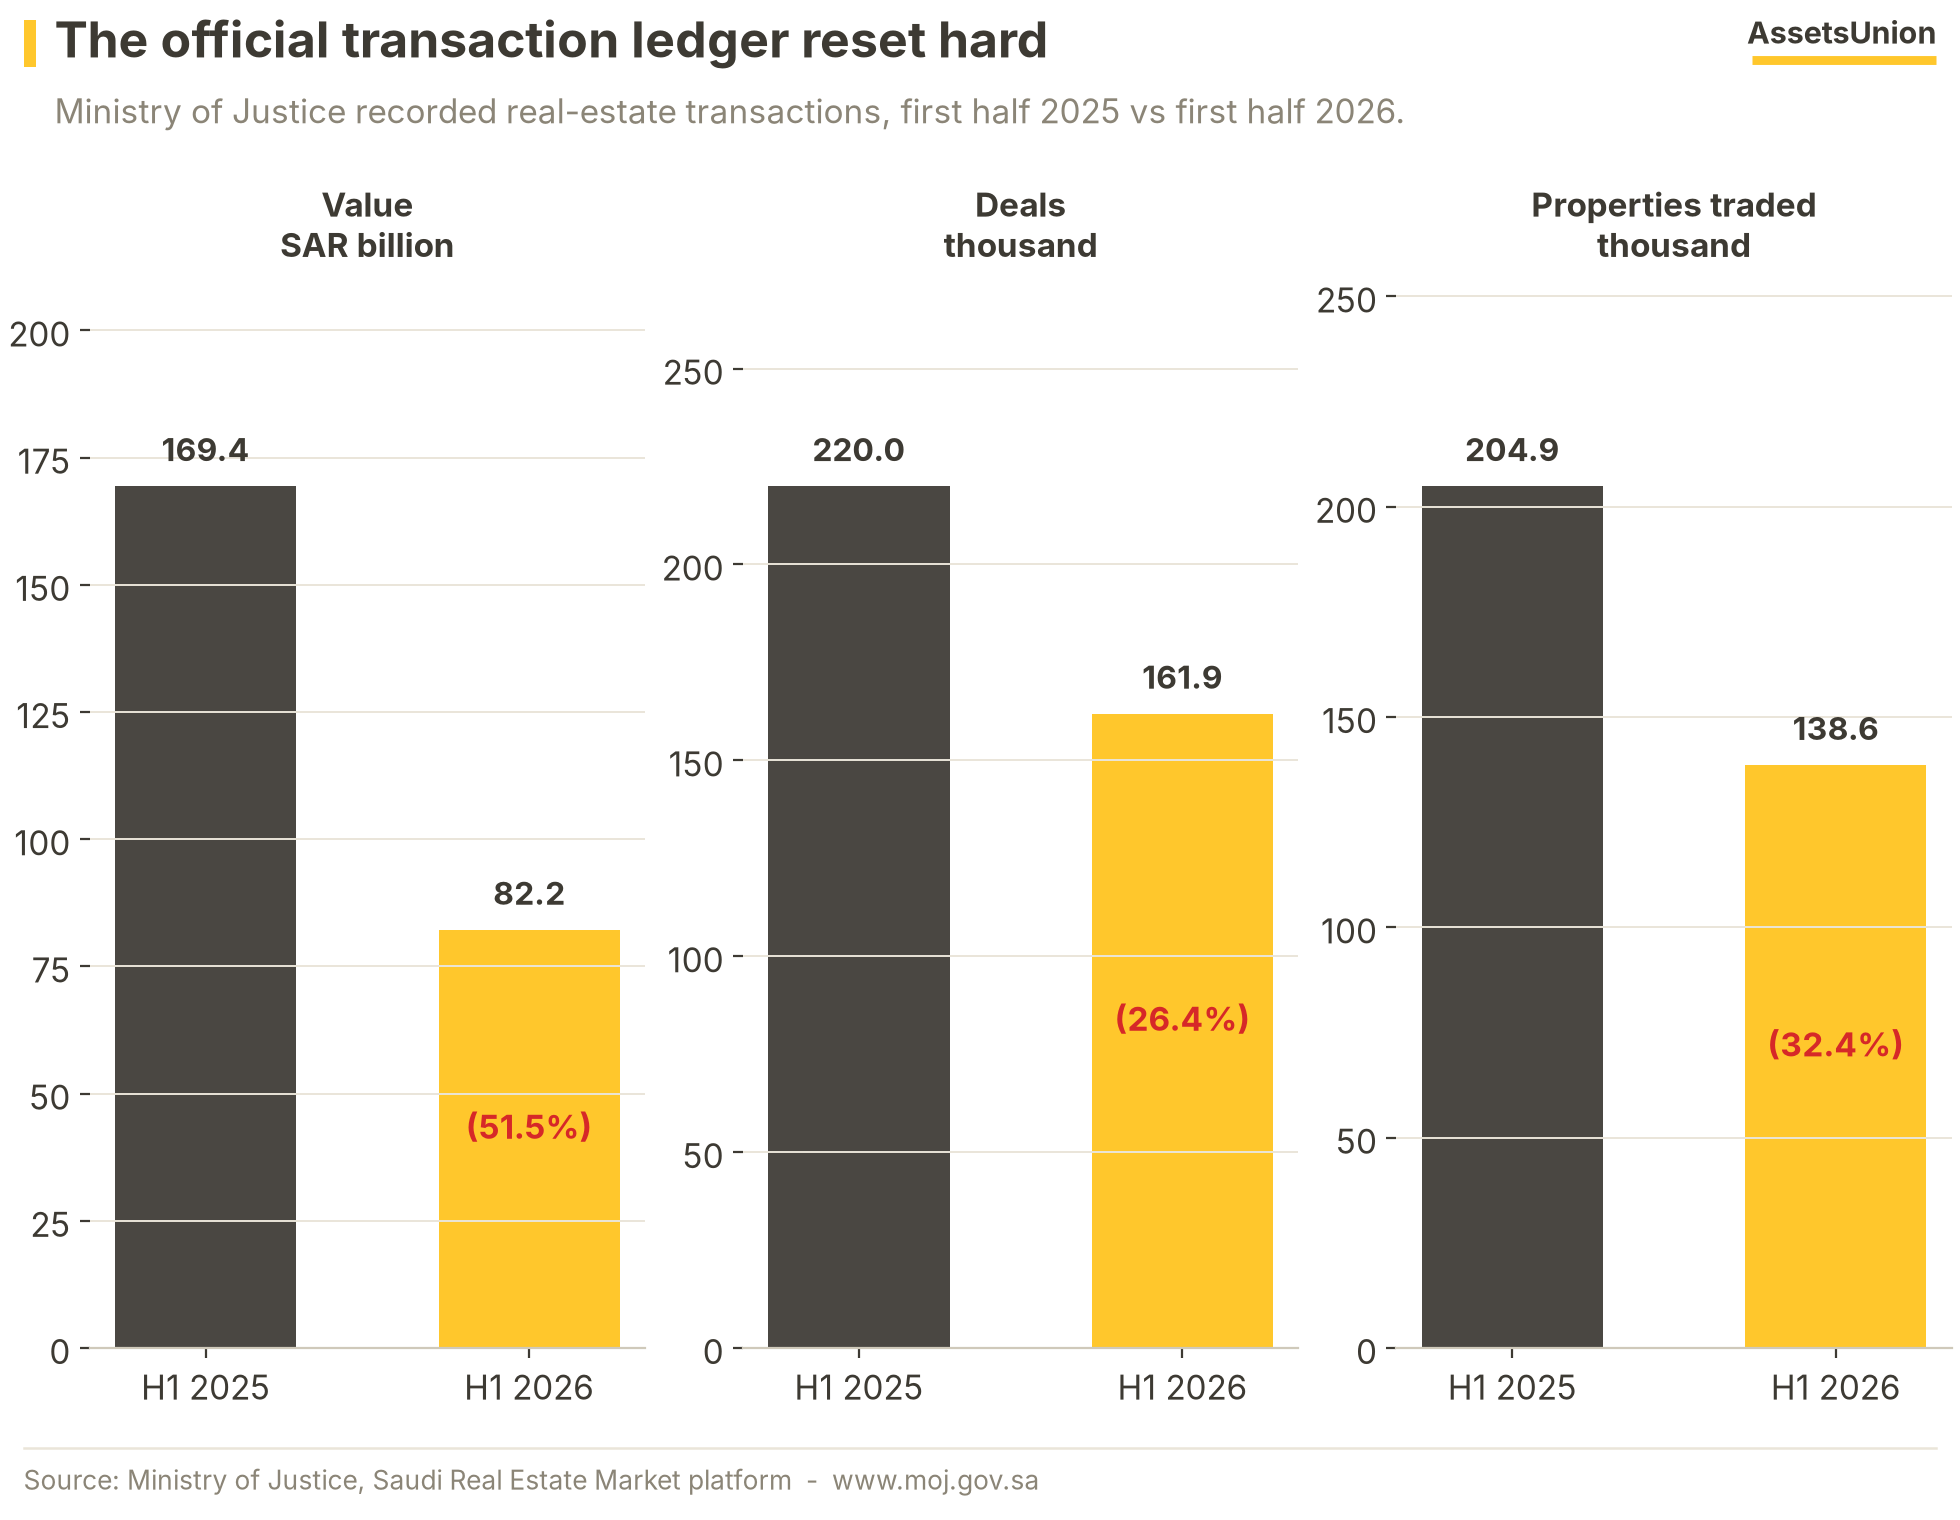
Recorded transaction value fell 51.5% to SAR 82.2 billion in the first half of 2026, against SAR 169.4 billion a year earlier; deal count fell 26.4% and traded properties 32.4%. Value falling twice as fast as volume implies the mix shifted toward smaller-ticket deals - consistent with the mortgage data, where villas' share held but average ticket sizes edged down.
How 2026 Opened
Residential prices down, commercial up, and a sharp regional divergence - the correction is uneven by design.
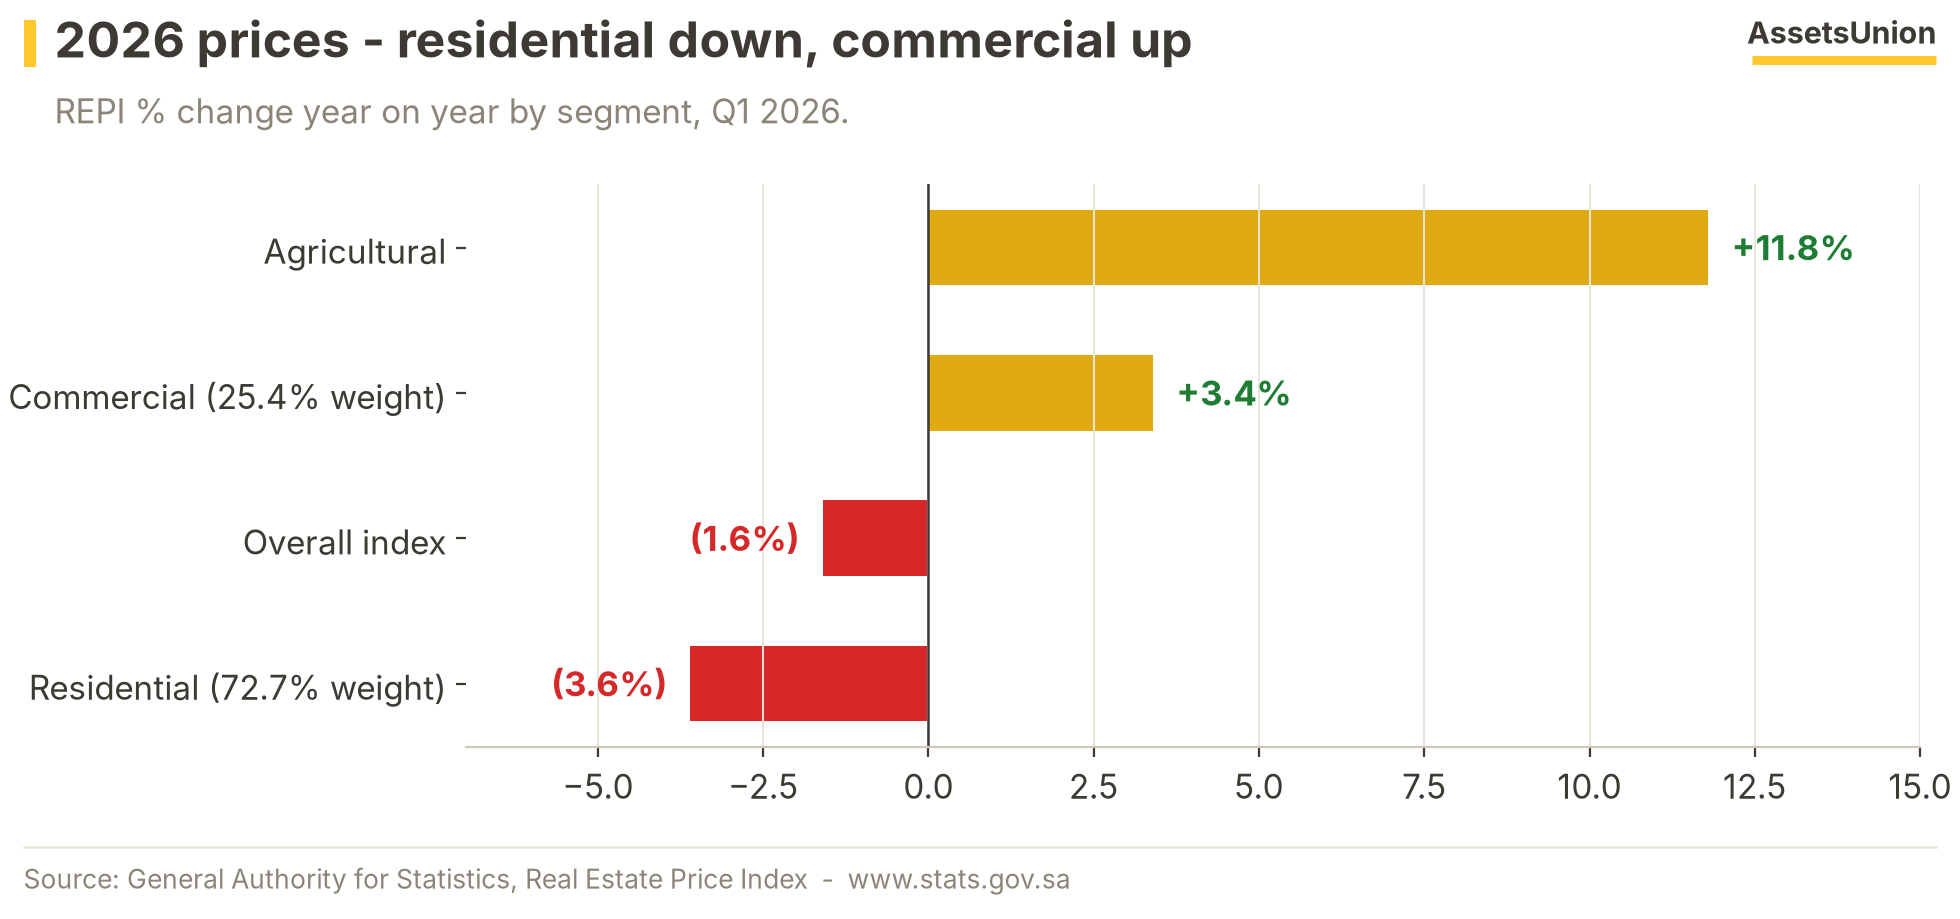
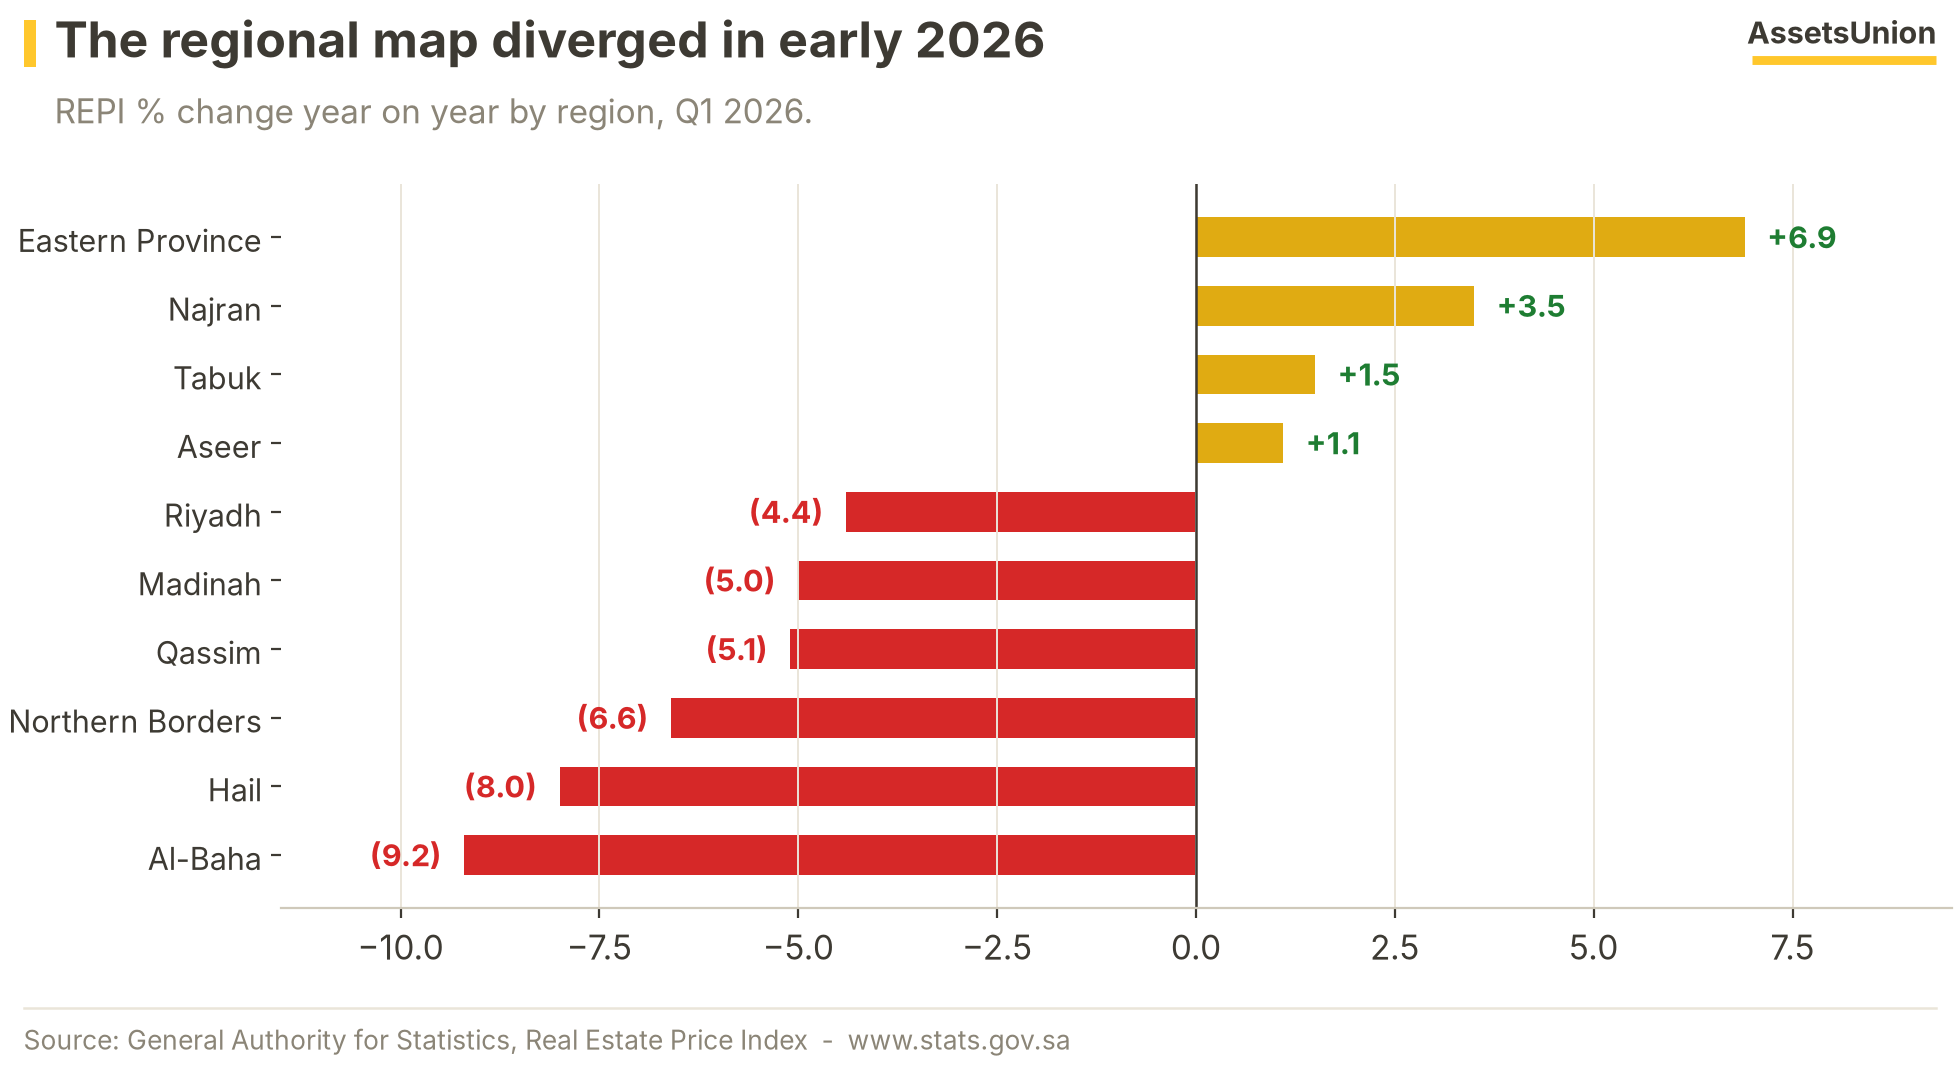
The Q1 2026 REPI put the overall index at (1.6%) with residential at (3.6%) while commercial rose +3.4%. Regionally the Eastern Province gained +6.9% while Riyadh fell (4.4%) and Al-Baha (9.2%). On the SAMA series, first-quarter mortgage lending of SAR 15.75 billion was (43%) below Q1 2025 - the leading indicators point to a slow first half before the foreign-ownership regime can add a new demand channel.
Listed Real Estate Repriced
The equity market marked real estate down long before the ledgers did - 17 of the 19 listed REITs closed 2025 lower.
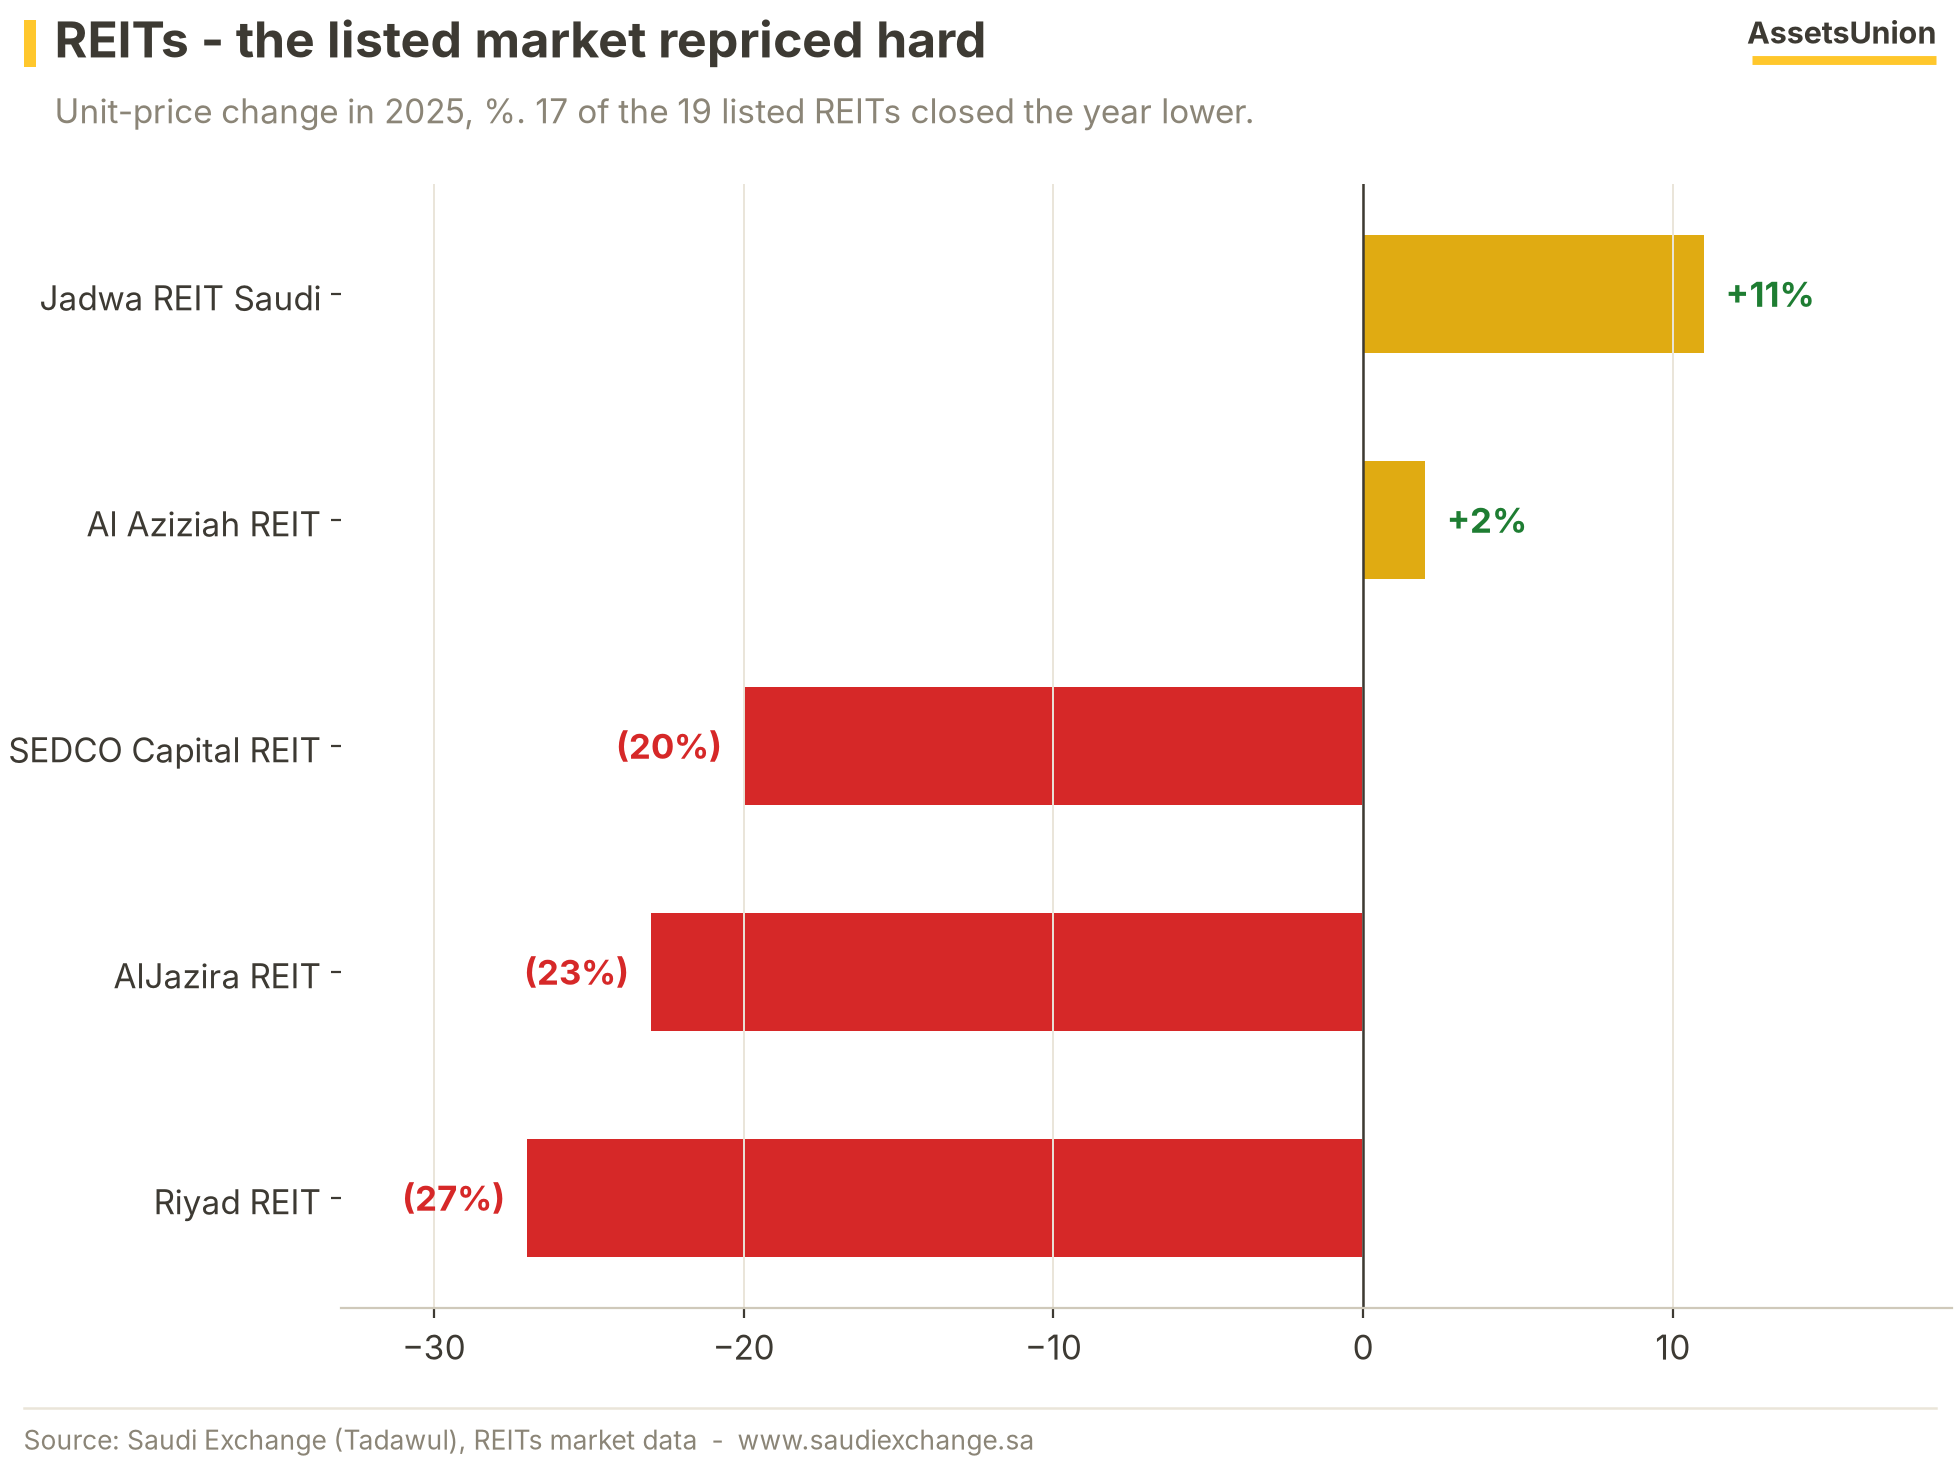
Riyad REIT led the declines at (27%), followed by AlJazira REIT at (23%) and SEDCO Capital REIT at (20%); only Jadwa REIT Saudi (+11%) and Al Aziziah REIT (+2%) finished higher. A REIT trades daily while appraisal-based valuations move quarterly at best - the listed market is the sector's fastest price-discovery mechanism, and through 2025 it priced exactly the tightening that the mortgage and transaction ledgers recorded. Unit prices falling also lifts distribution yields mechanically, which makes the sector one of the cleanest expressions of SAMA's easing path into 2026.
What We Are Watching
What we are tracking for 2026 - the conditions we watch in every issue and what would change the picture.
| Base path | What would improve it | What would worsen it | |
|---|---|---|---|
| Lending | H1 2026 stays soft; YoY comparisons ease from May onto the weak 2025 base | Monthly prints back above SAR 8B | Renewed sub-SAR 5B months |
| Prices | Residential REPI negative into mid-2026; regions stay split | Eastern Province strength broadening toward Riyadh | Riyadh declines deepening past (5%) |
| Policy | Designated-zone maps and implementing rules land during 2026 | Early activation of Riyadh and Jeddah zones | Implementing rules slipping toward 2027 |
| Rates | Repo holds at 4.25% until the US Federal Reserve moves | Further cuts restoring affordability | A long hold with no lending pass-through |
Highlights
- New mortgage lending SAR 80.4B, (12%) YoY across 108,800 contracts
- Residential REPI (2.24%) in Q4 - prices rolled over in H2
- Homeownership 66.24% - against the Vision 2030 target of 70%
- SAMA cut the repo rate to 4.25% in December (reverse repo 3.75%)
- TASI (12.84%) to 10,490.69 - its steepest fall in a decade; White Land fee ceiling raised to 10%
Sources & Disclaimer
Sources
Disclaimer
This publication has been prepared by the Research Center of AssetsUnion, an independent research desk, and is issued for general information and non-commercial purposes only. It is not, and should not be construed as, an offer, solicitation, or recommendation to buy or sell any security, real-estate asset, or financial instrument, nor does it constitute investment, financial, legal, tax, or accounting advice of any kind. AssetsUnion is not licensed or supervised by the Saudi Capital Market Authority, and nothing herein constitutes a securities recommendation. AssetsUnion is likewise not licensed or supervised by the UAE Securities and Commodities Authority or the Dubai Financial Services Authority, and this publication is not directed at any person in any jurisdiction where its distribution would be unlawful. The information contained herein is drawn from official public sources believed to be reliable; AssetsUnion does not independently audit such information and makes no representation or warranty, express or implied, as to its accuracy, completeness, or fitness for any purpose. Figures, estimates, and opinions relate to the periods stated and are subject to change without notice. Past performance is not a reliable indicator of future results, and forward-looking statements involve risks and uncertainties. Neither AssetsUnion nor its principals accept any liability for any direct, indirect, or consequential loss arising from the use of this publication or reliance on its contents. This publication may not be reproduced or redistributed, in whole or in part, for commercial purposes without prior written consent. Recipients should conduct their own due diligence and consult their own professional advisers before making any investment, financing, or real-estate decision.